- Mobile app
- Energy
- Design system
Chilicon Power · case study
From an engineer's dashboard to an answer in one second.
Solar monitoring for systems built on microinverters. In 2021 I designed the first mobile app for a data-heavy engineering dashboard; in 2026 I redesigned it around one question, is my system OK, for homeowners and installers, and built it as a working prototype with AI.
- Role
- UX/UI Designer
- Timeline
- 2021 · revisited 2026
- Company
- Chilicon Power
- Location
- California, USA
- Team
- The only UX/UI designer in a team of 6: 1 front-end and 2 back-end developers, 1 QA, 1 PM
Deliverables
- UX audit
- User flows
- Alert model
- Mobile prototype
- Design system
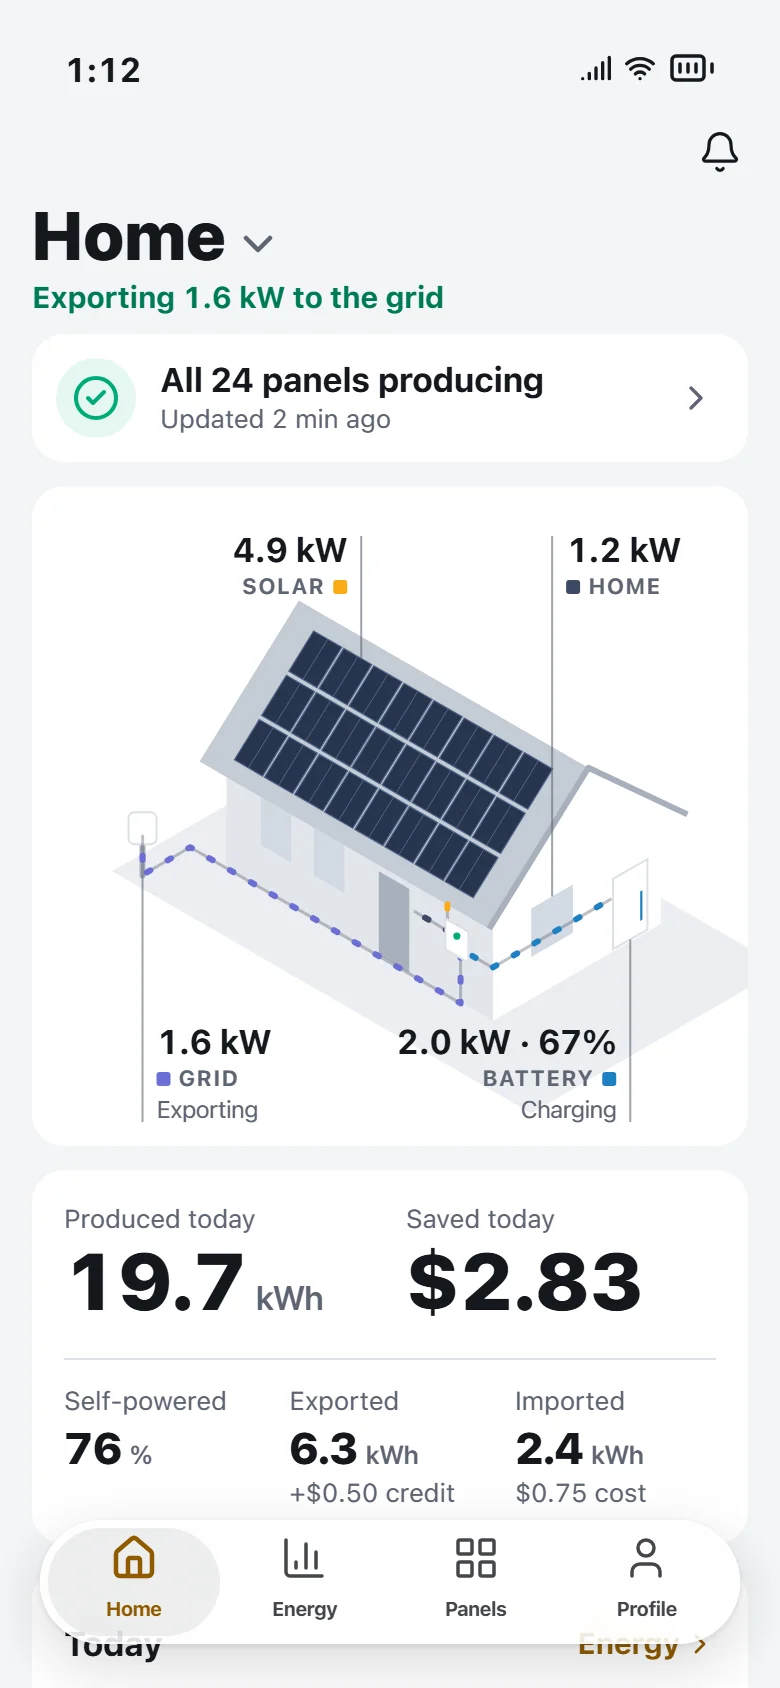
- to know the system is fine: the status card comes first
- 1 s
- roles in one app, one data model
- 2
- codes to type in setup: scan the gateway
- 0
- contrast in light and dark, 0 axe violations
- AA
Overview
The data told engineers everything. It told homeowners nothing.
Chilicon Power, founded in 2009 in Southern California and part of Generac since 2021, makes microinverters: small boxes behind the solar panels. Its CP-720 serves two panels at once, so a roof reports output for every pair, not just a total. That makes it possible to spot one failing panel on a roof of twenty-four.
All of that lived in a desktop dashboard built for engineers: gauges, heatmaps, per-device line charts. The warranty depends on the system staying connected, yet owners had no reason to open a tool that never answered their question.
In 2021 I was the only UX/UI designer on a team of six that brought monitoring to mobile for the first time. In 2026 I audited that app, redesigned it around one question, is my system OK, and built it with AI as a working prototype for homeowners and installers.
Two people look at the same roof for different reasons.
Homeowner
Checks once a day or less; more often right after installation or when the bill arrives. Does not know what a microinverter is.
Reassurance that it works, proof of what it saves, and a heads-up only when something needs doing.
Installer
Maintains dozens of sites, often on the road. Commissions new systems standing on a driveway with a phone.
Problems first, sorted by severity, with enough detail to fix remotely before rolling a truck.
Research
Our 2021 app moved the dashboard to a phone. It never answered the question.
I went back to our 2021 screens and the desktop dashboard they came from, and reviewed them against what an owner and an installer actually need to know.
- 01No answer to “is it working?”
- 02Live or stale looked the same
- 03The flow had no direction
- 04Per-panel data stayed on desktop
- 05Setup meant copying codes
- 06Charts that misled
Define
Answer first, details on demand.
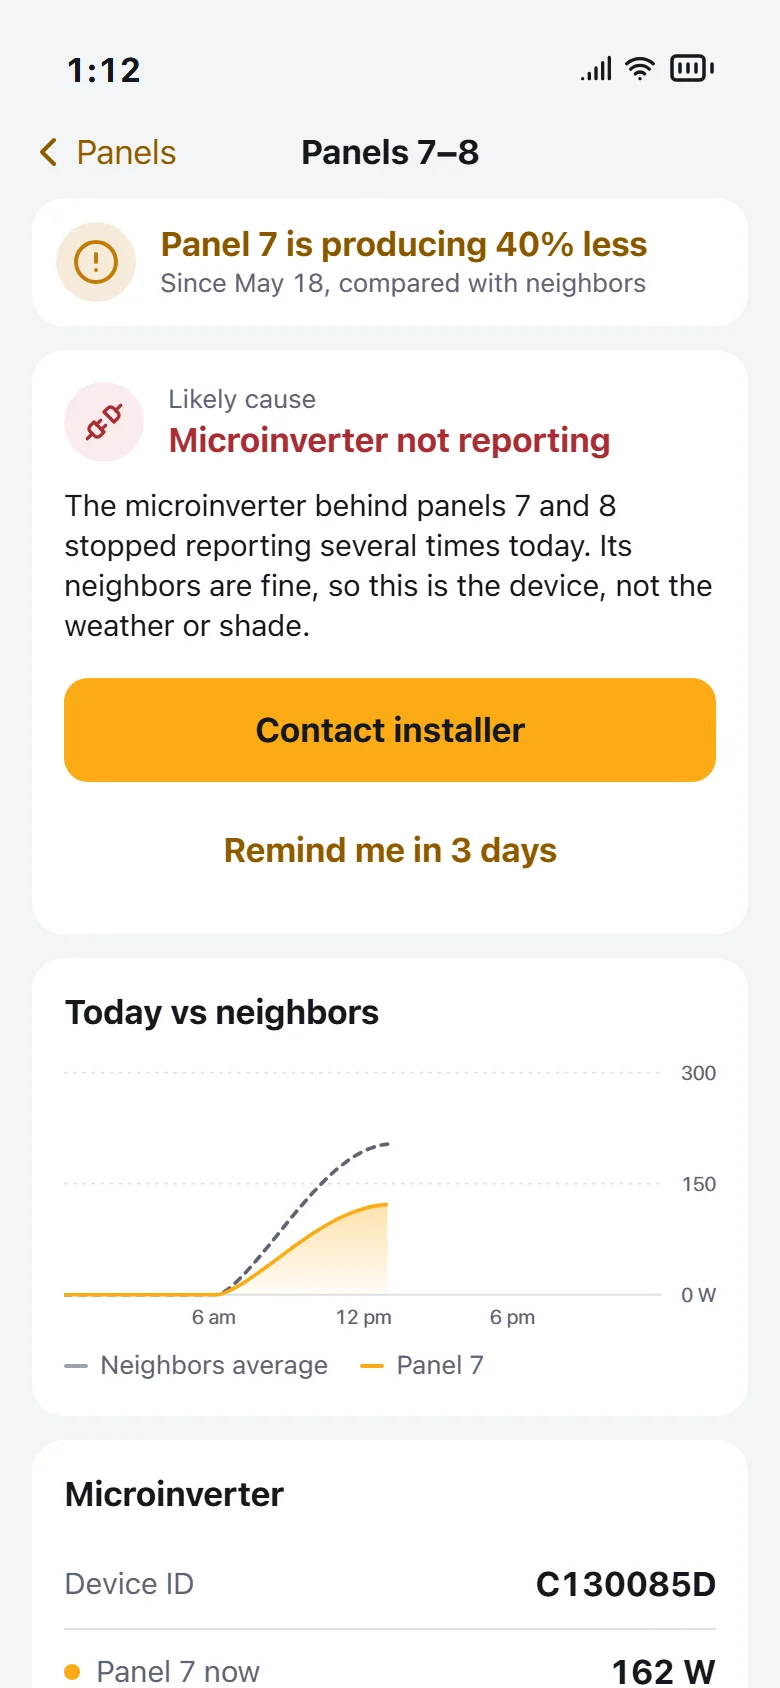
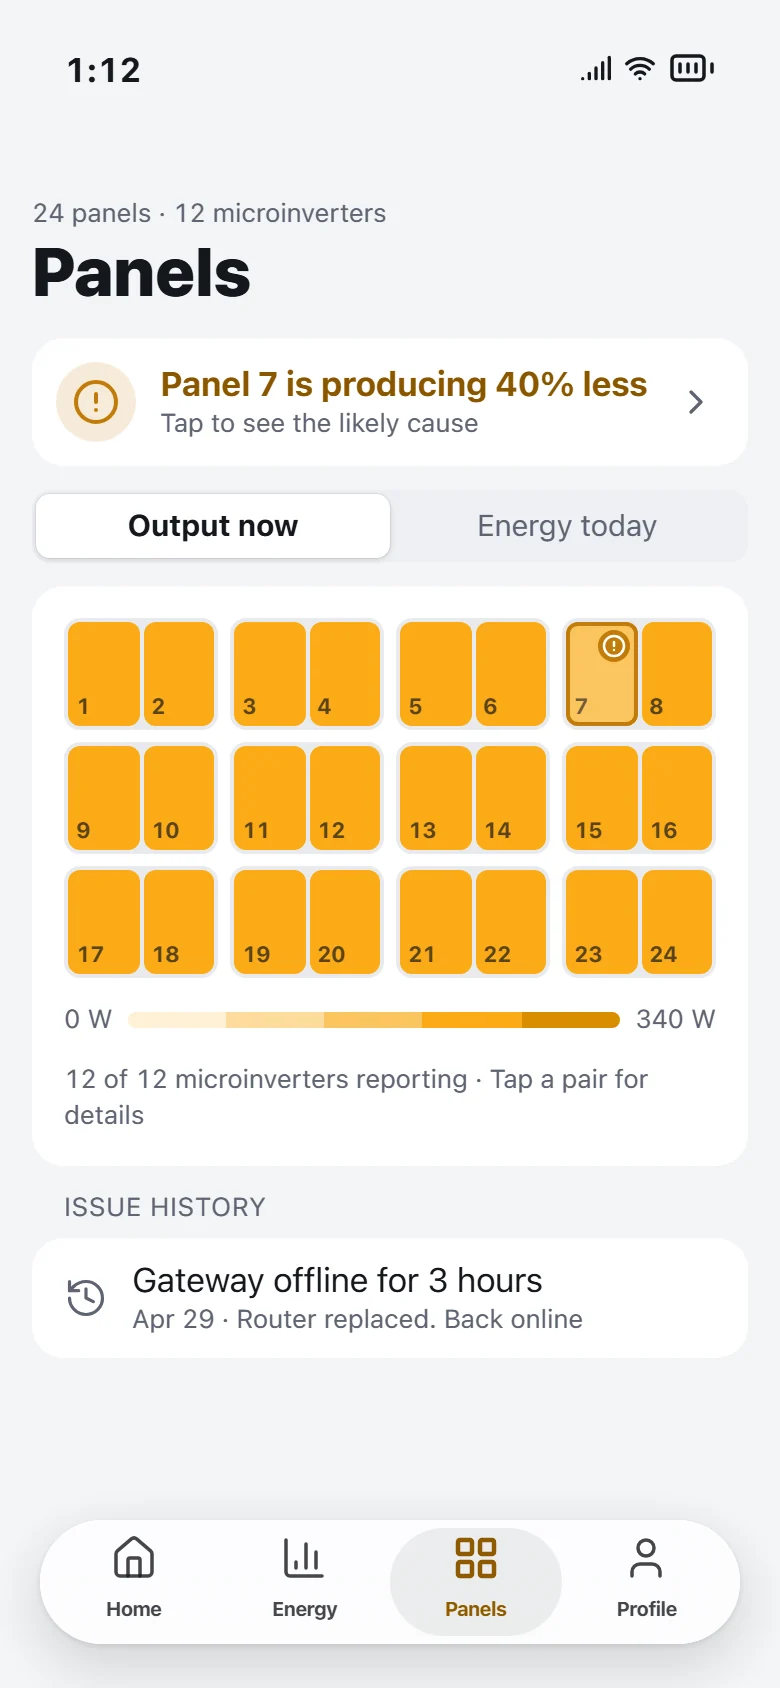
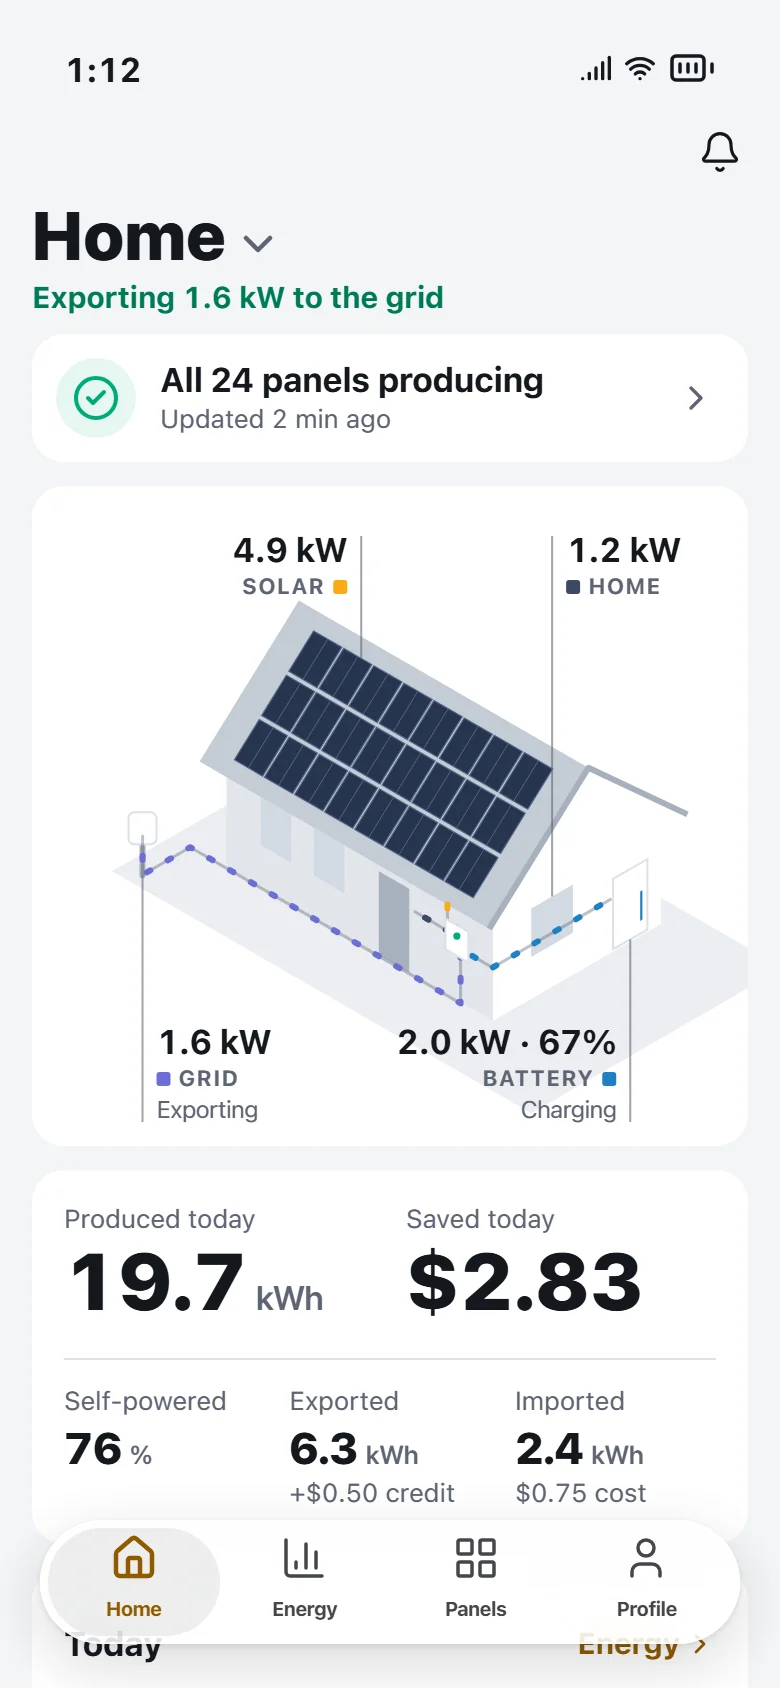
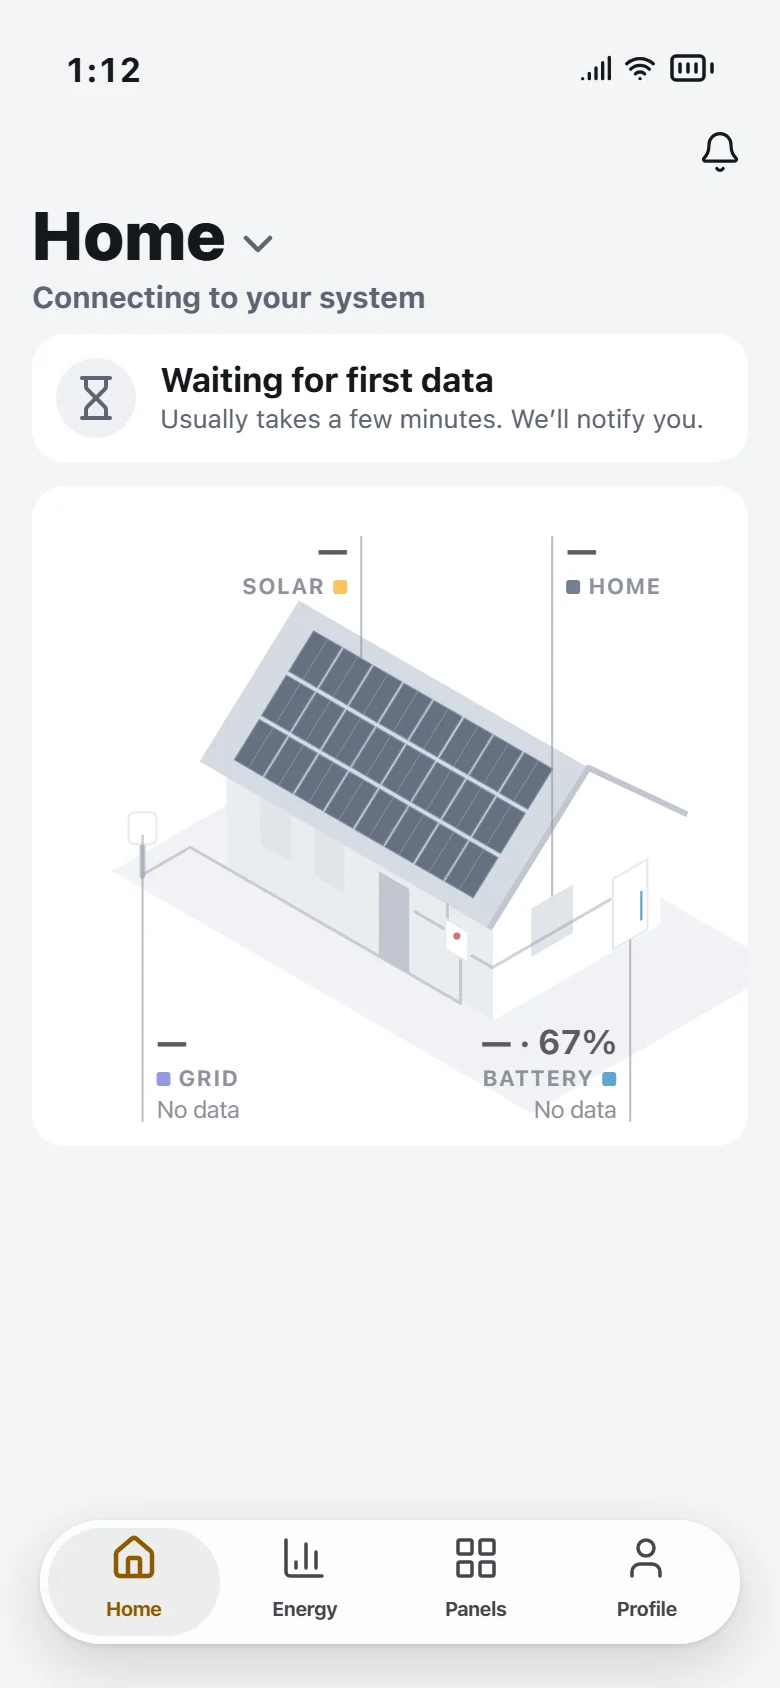
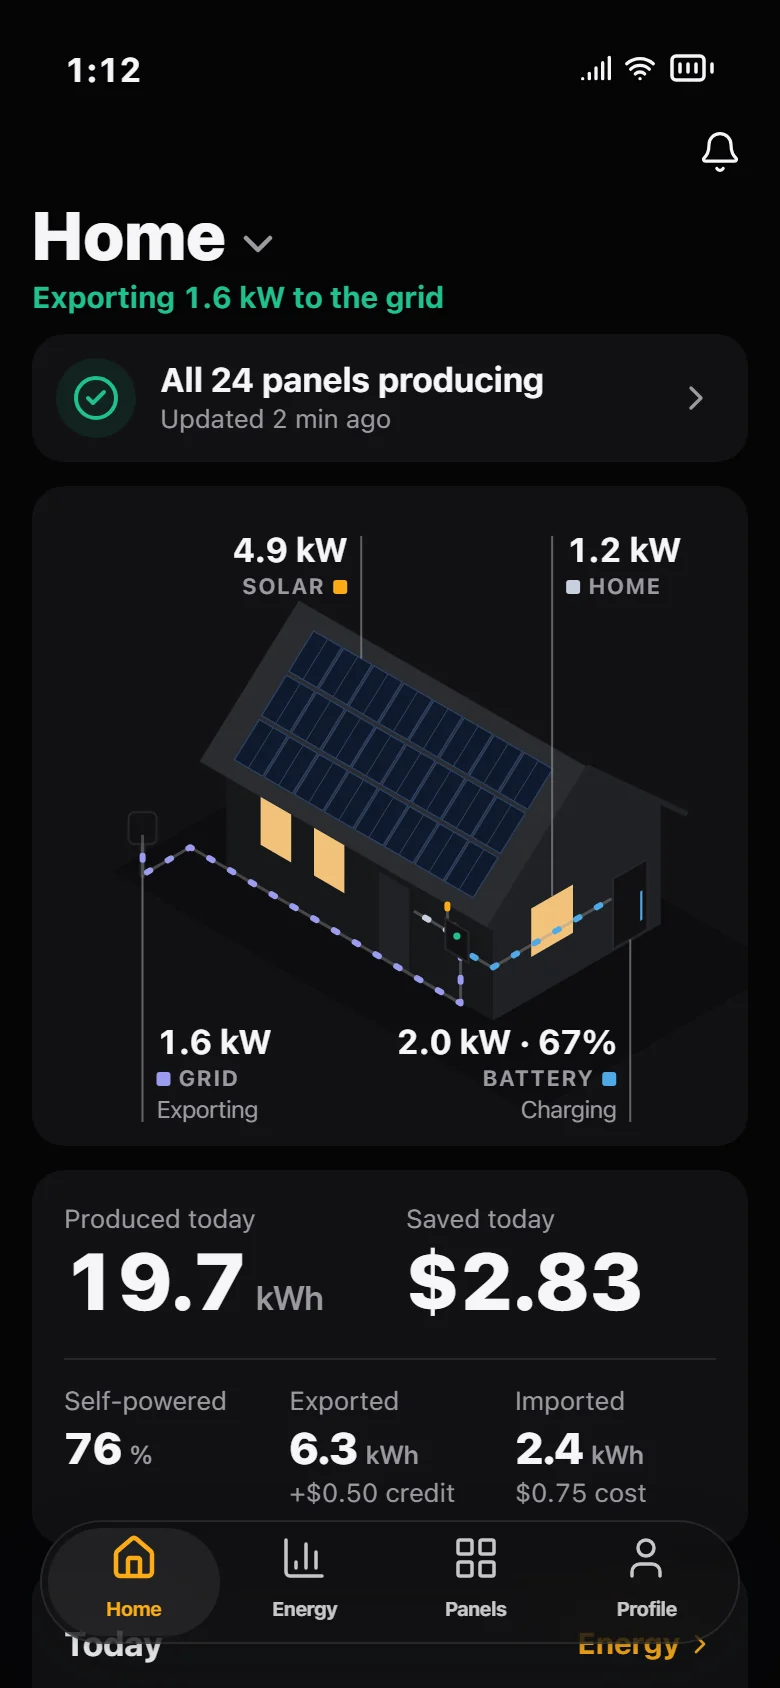
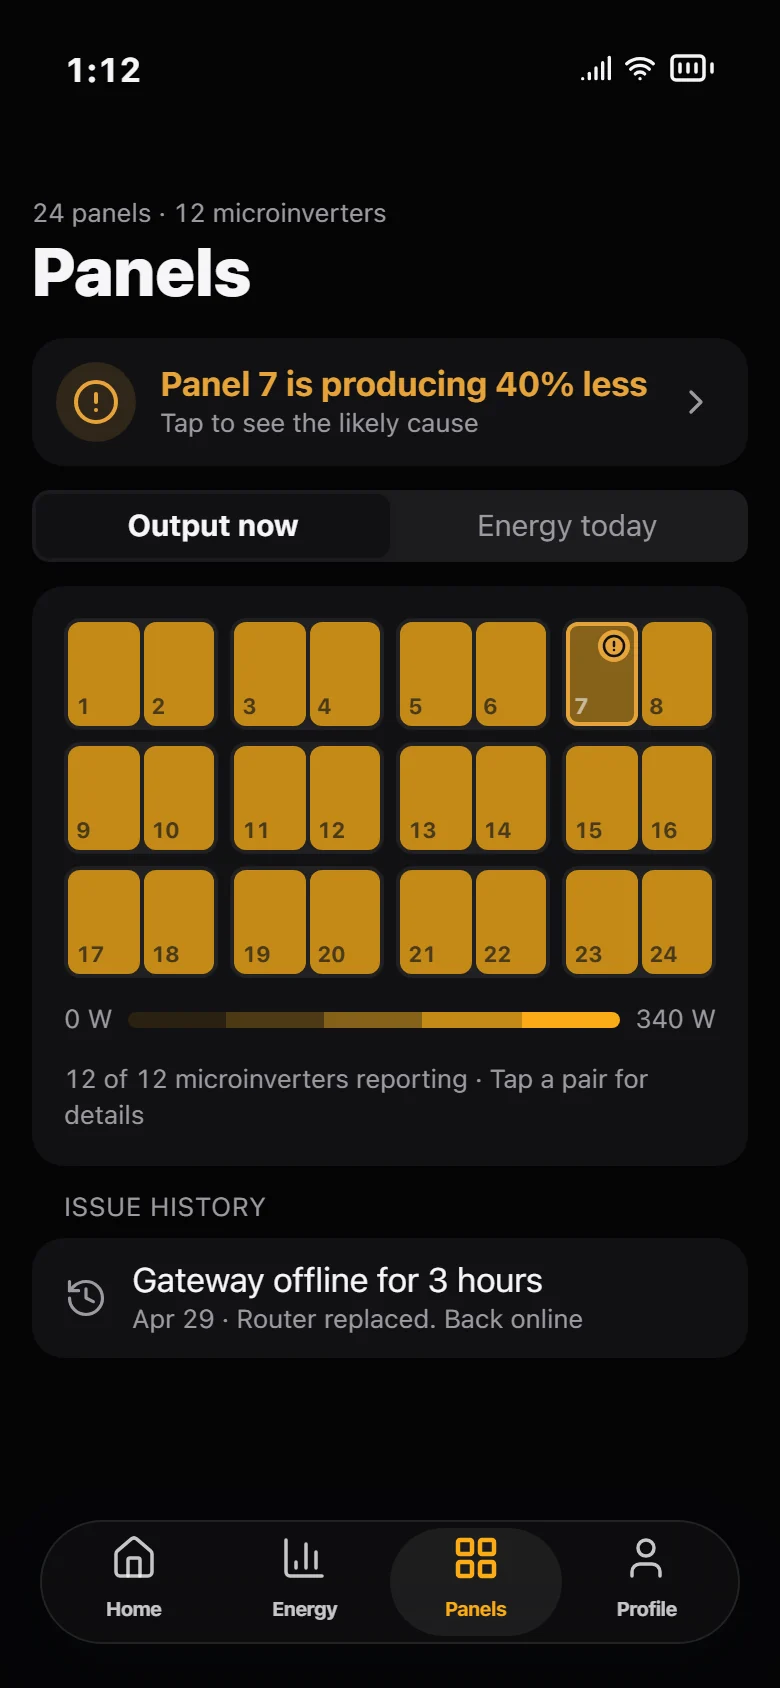
Every screen starts with a sentence, then numbers, then charts. Home says “All 24 panels producing · Updated 2 min ago” before anything else. The roof map shows which pair is weak without reading a chart, and a panel's detail says the likely cause and the next step.
I mapped the fault before the screens.
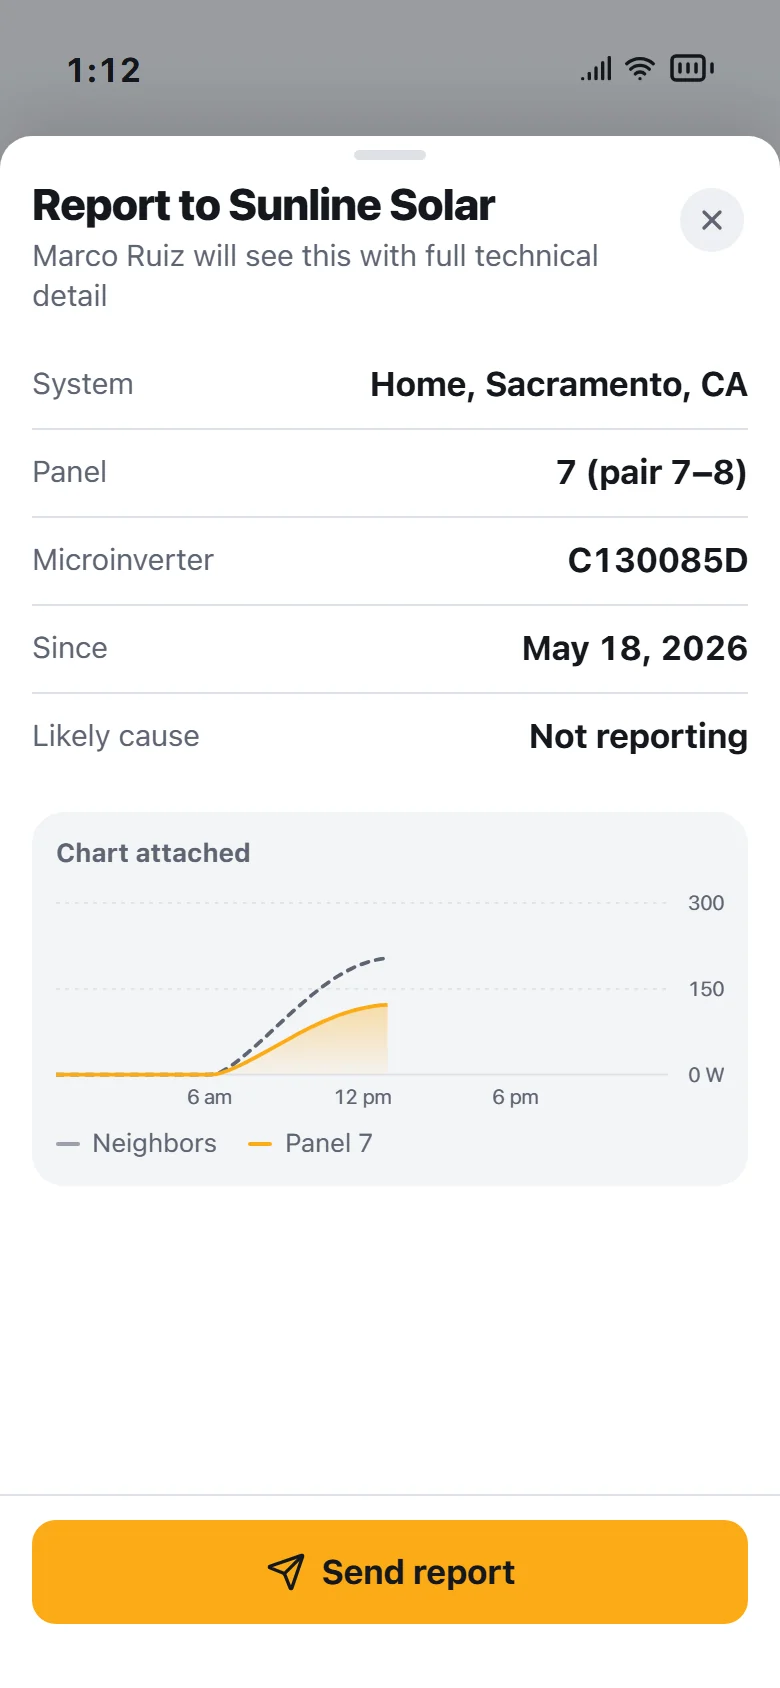
One weak panel crosses both roles. The flow shows the three likely causes, when an owner is told, and where the installer takes over, including owners with no installer linked.
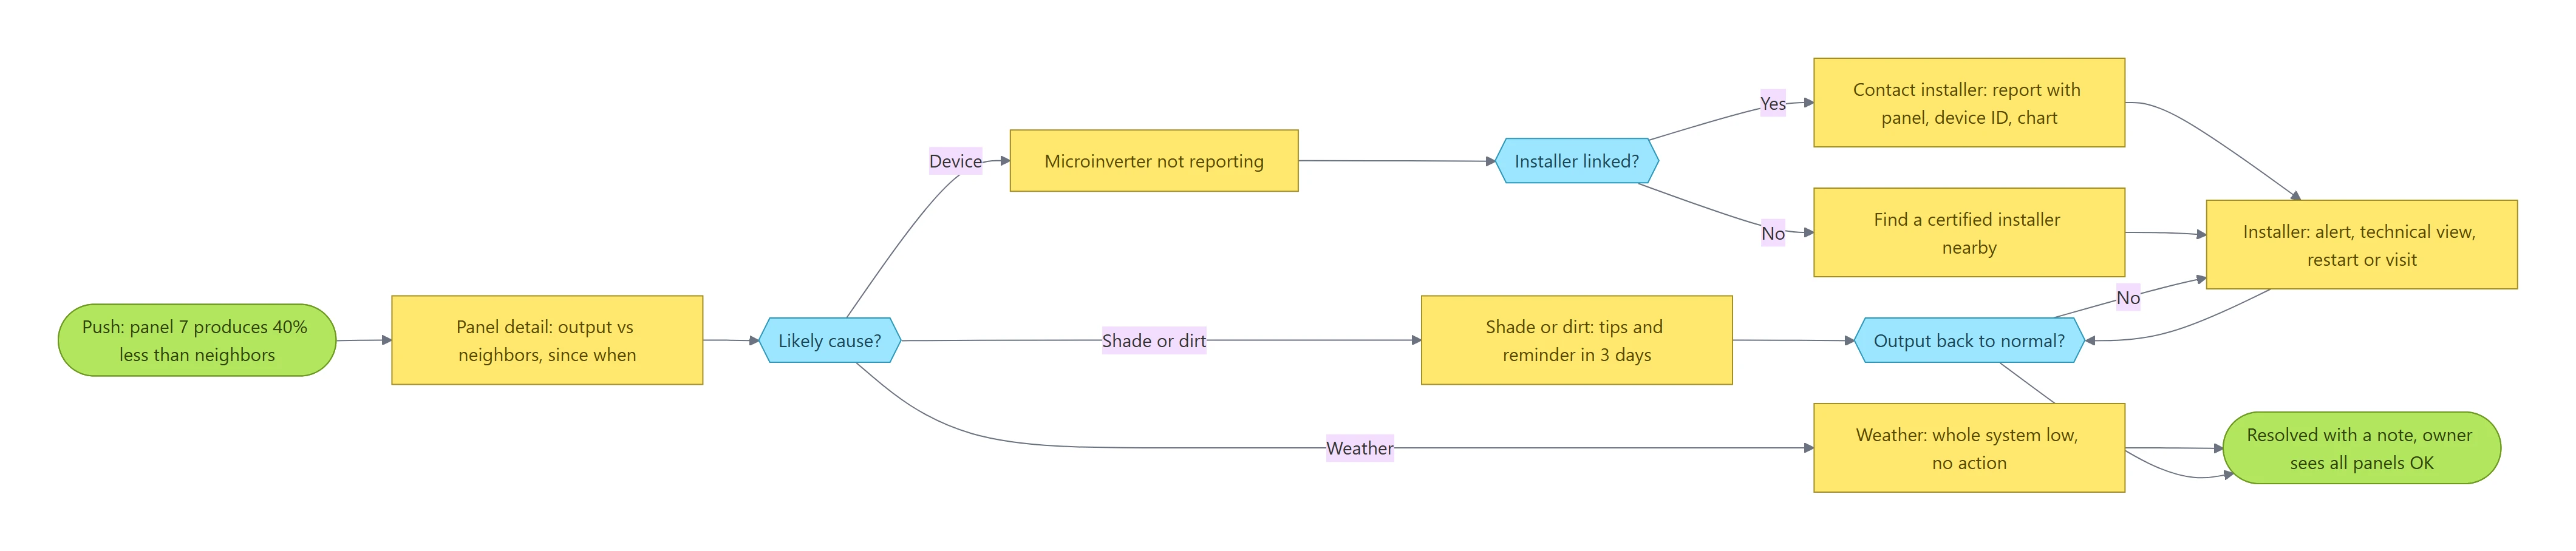
Alert only when there is something to do.
A cloudy day is not an alert. A silent microinverter is. I wrote down what each situation looks like in the data and what each role should see, so the app never cries wolf.
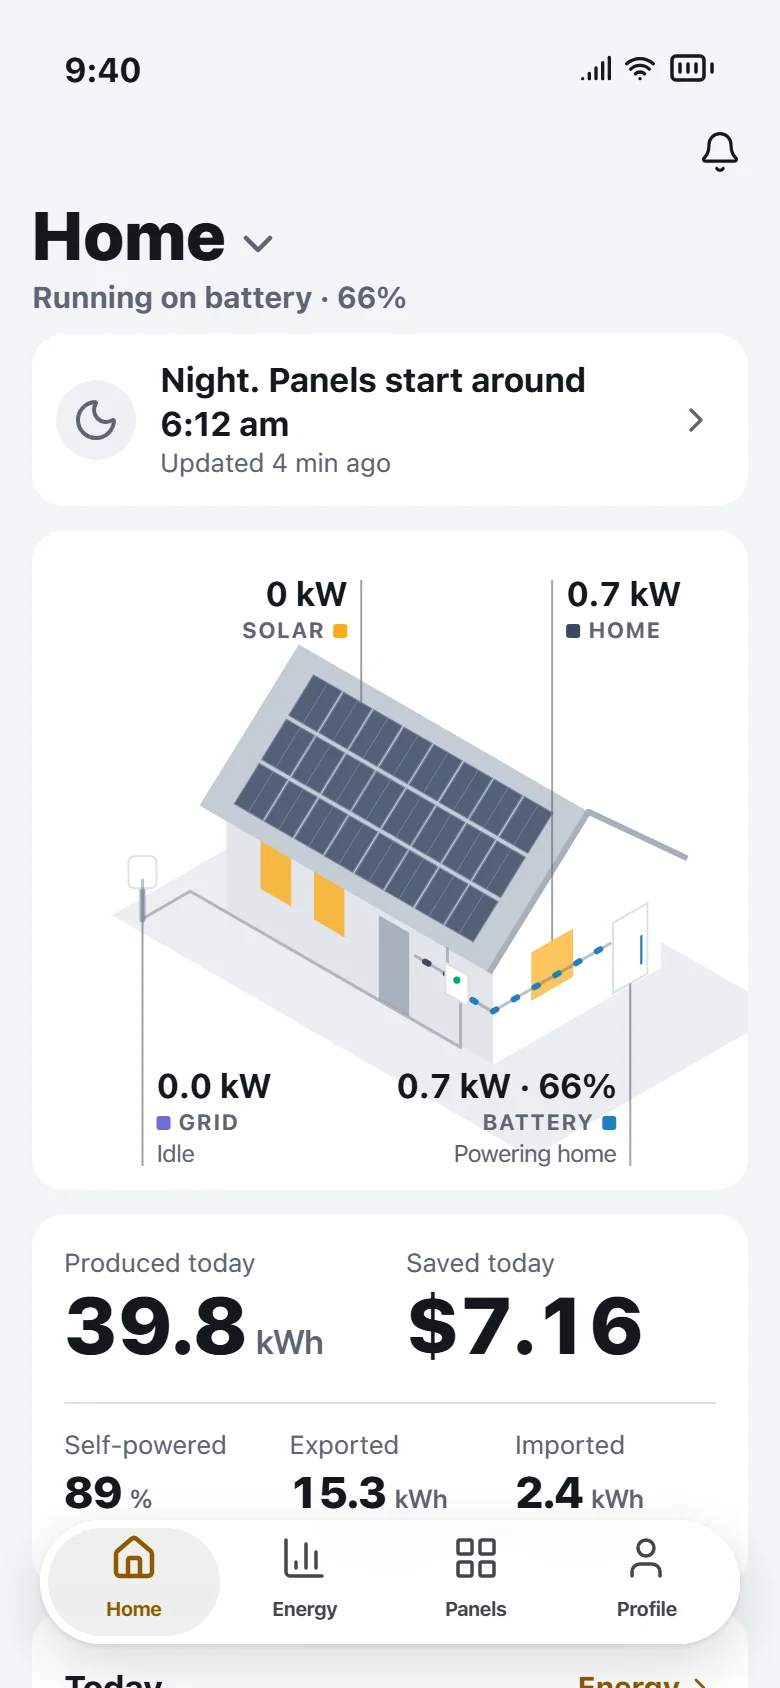
01 · Night
- In the data
- No output, sun is down
- 2021 app
- Numbers fall to zero, no reason
- What the owner sees
- “Night. Panels start around 6:12 am”
- Installer
- Nothing
- Push notification
- No
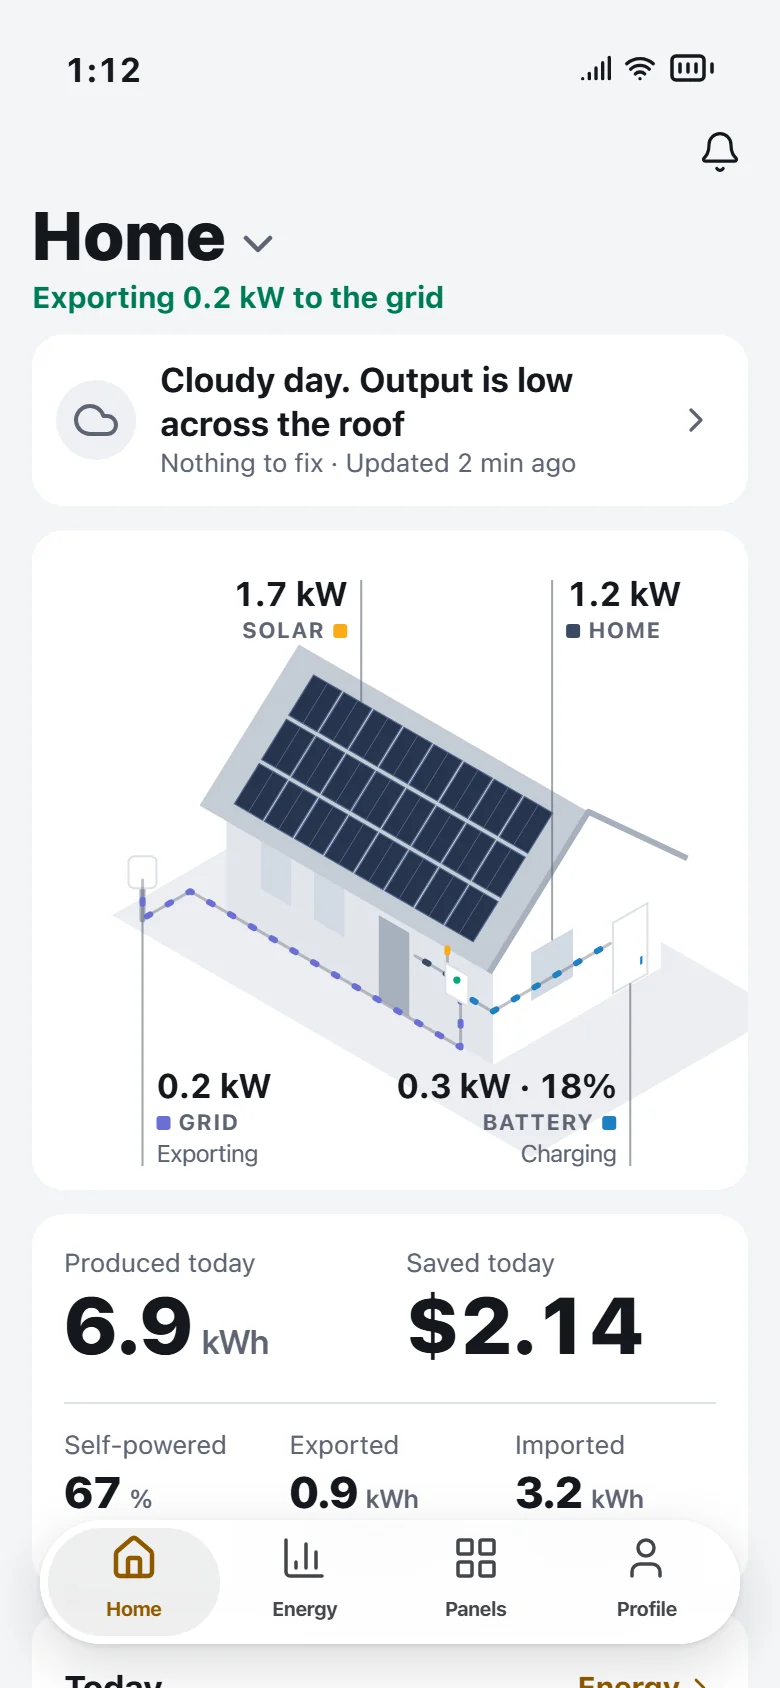
02 · Cloudy day
- In the data
- Every panel low by the same amount
- 2021 app
- Looks like a fault
- What the owner sees
- “Cloudy day. Nothing to fix”
- Installer
- Nothing
- Push notification
- No
03 · Shade or dirt
- In the data
- One panel low, mostly afternoons
- 2021 app
- Unnoticed for weeks
- What the owner sees
- Likely shade or dirt, 3 steps, reminder
- Installer
- Alert with the likely cause
- Push notification
- Yes, once
04 · Silent microinverter
- In the data
- One device drops out
- 2021 app
- Visible only on desktop
- What the owner sees
- Not reporting, contact installer
- Installer
- Alert, tagged if the owner reported it; remote restart
- Push notification
- Yes
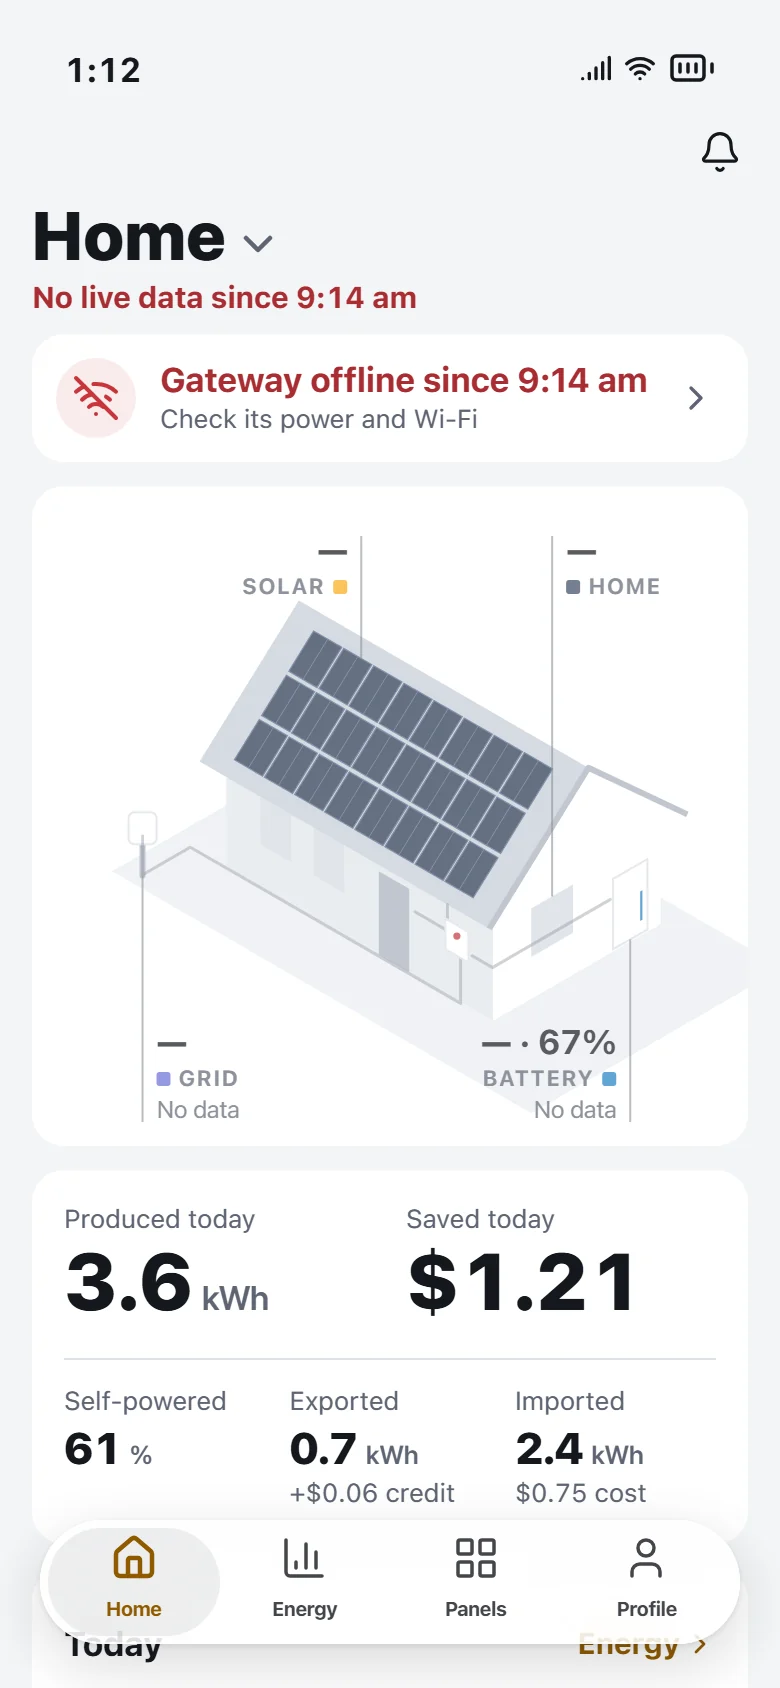
05 · Gateway offline
- In the data
- No data at all
- 2021 app
- Stale numbers, no timestamp
- What the owner sees
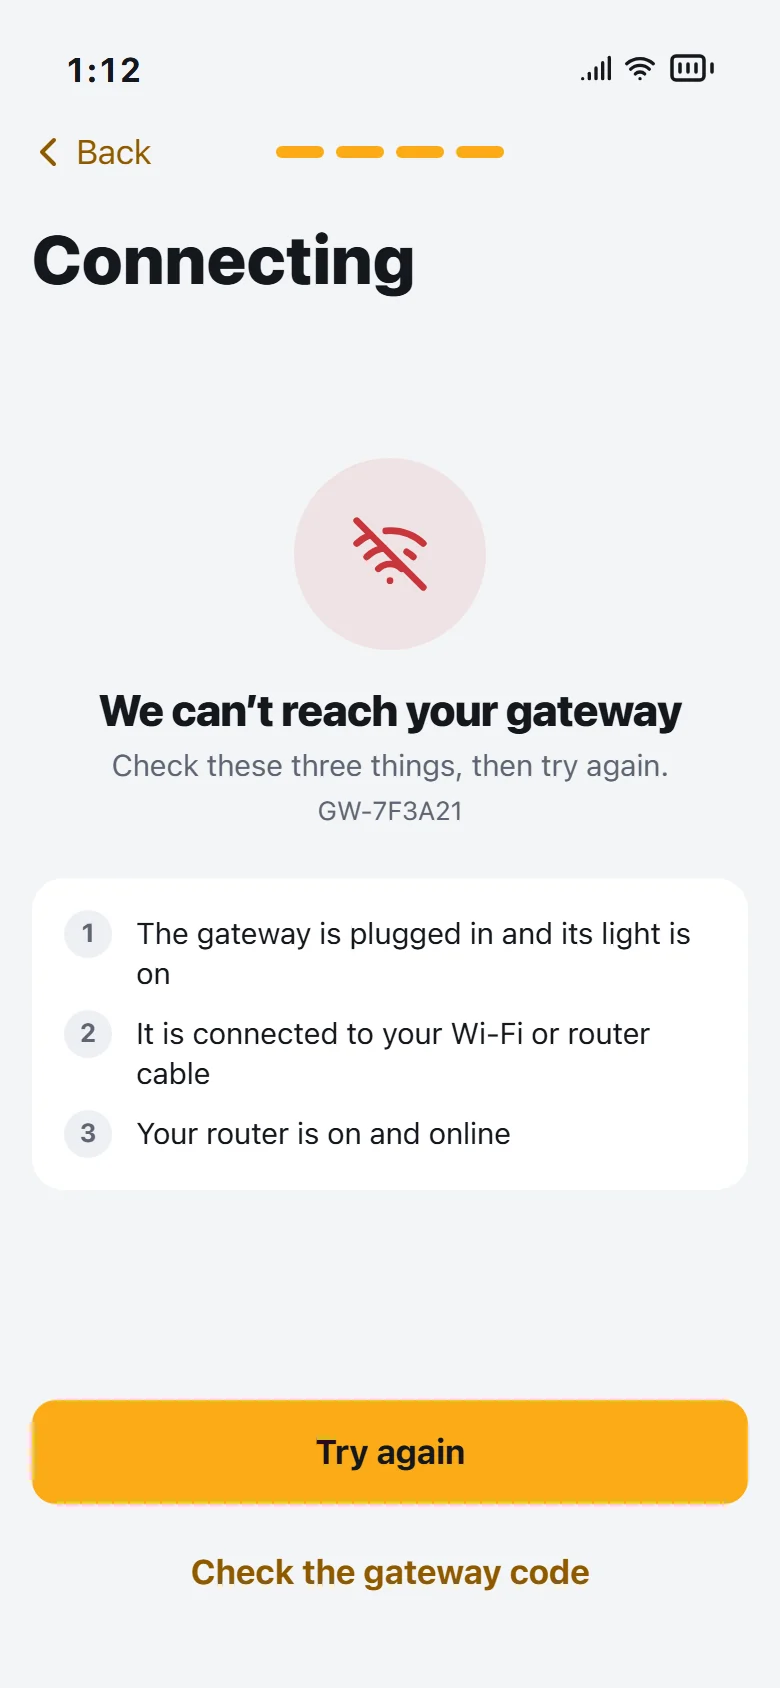
- What to check: power, Wi-Fi, retry
- Installer
- Offline site on top; visit
- Push notification
- Yes, after an hour
Before and after
Every finding, next to what replaced it.
Finding 01
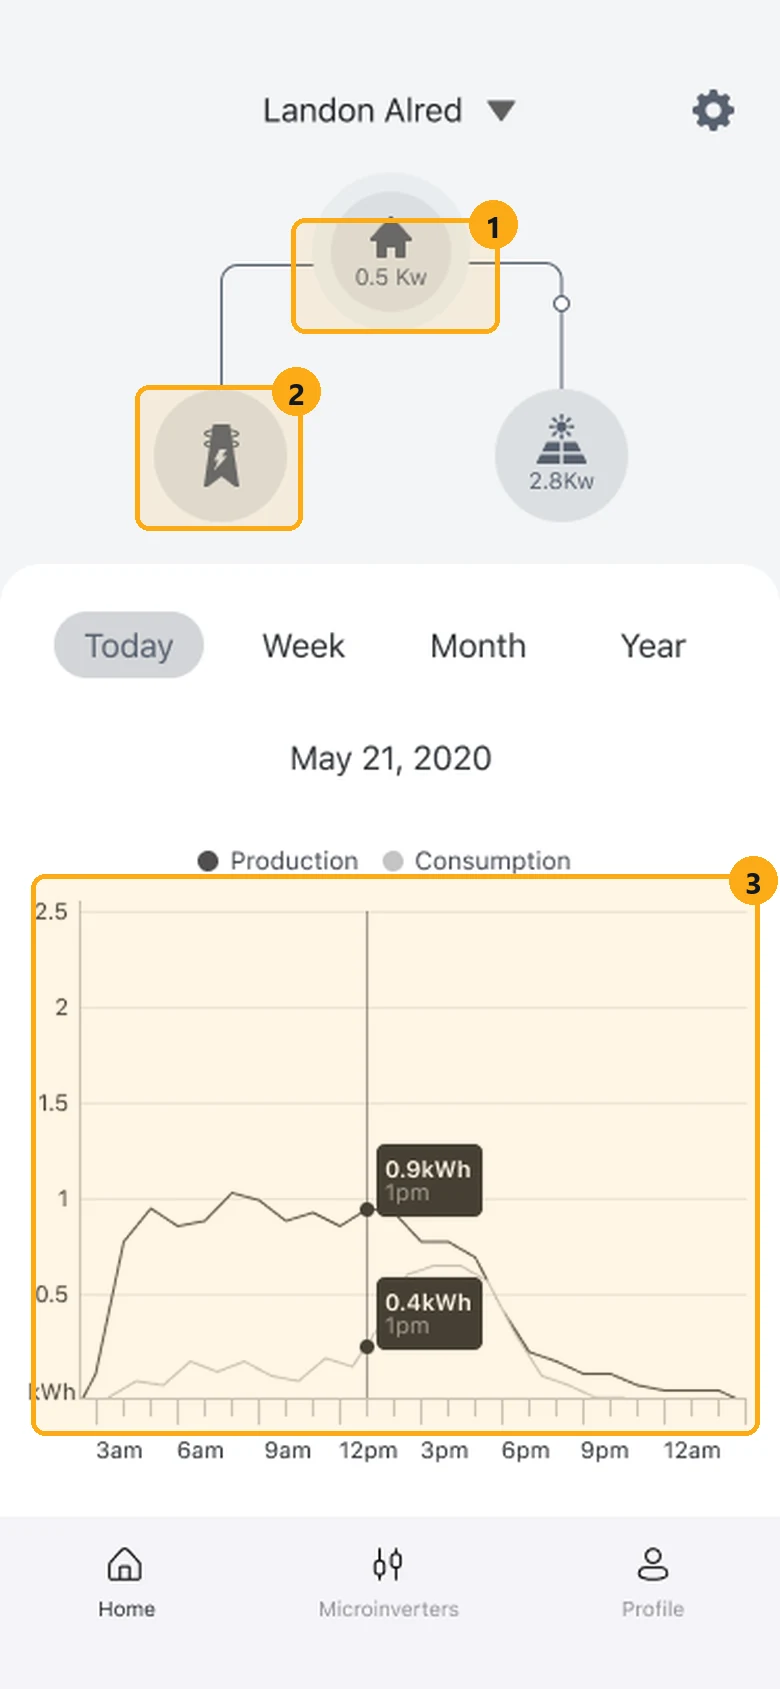
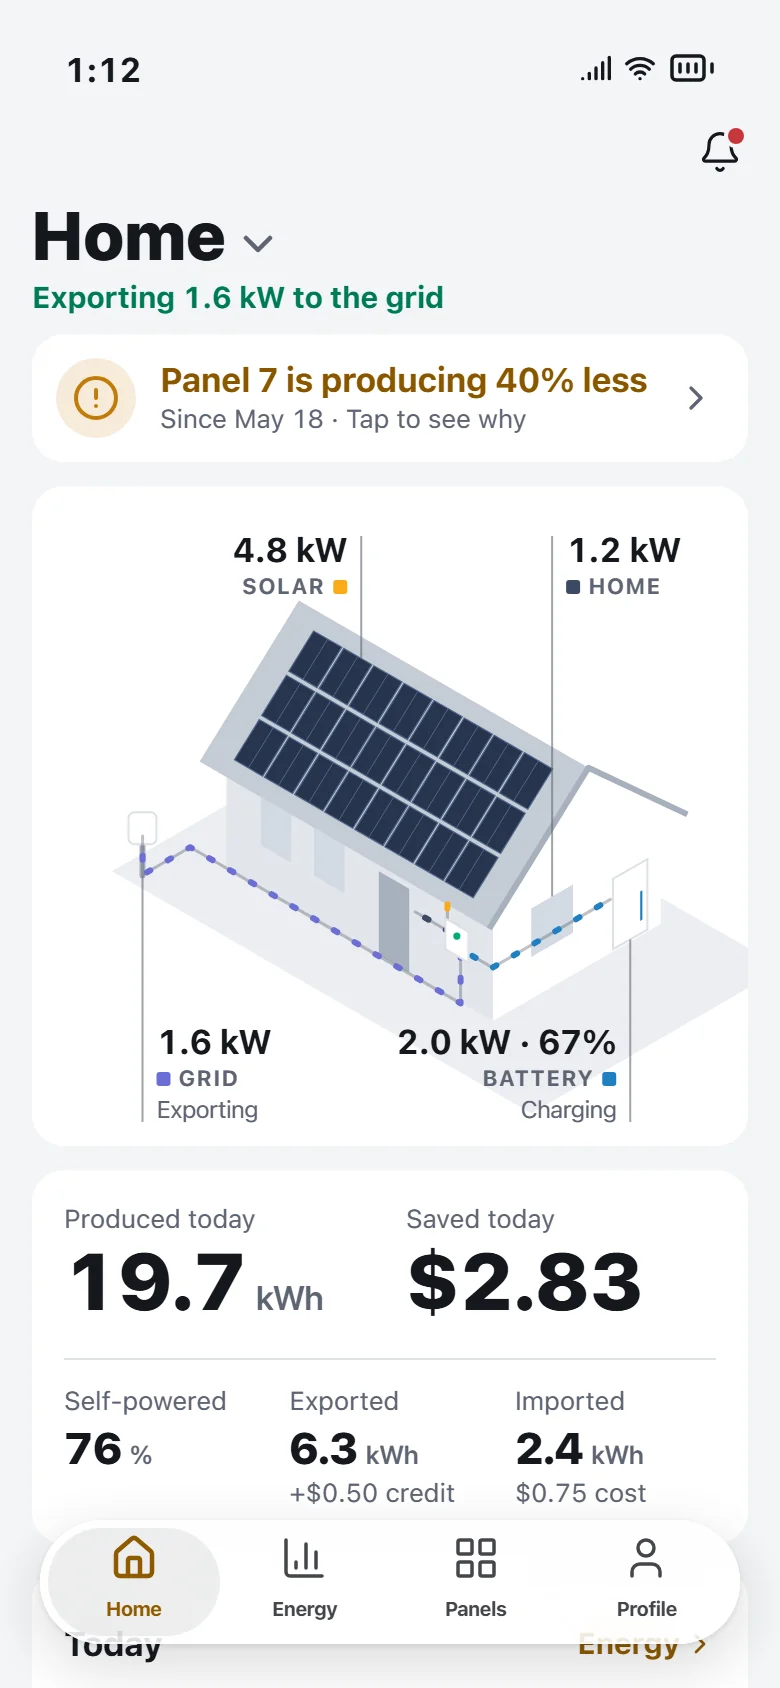
Home showed numbers, never an answer
A status card comes first, with how fresh the data is. The energy flow became a house with a value and a direction on every line: “Exporting 1.6 kW”, battery “Charging”.
Version 1 · 2021
Redesign · 2026
Finding 02
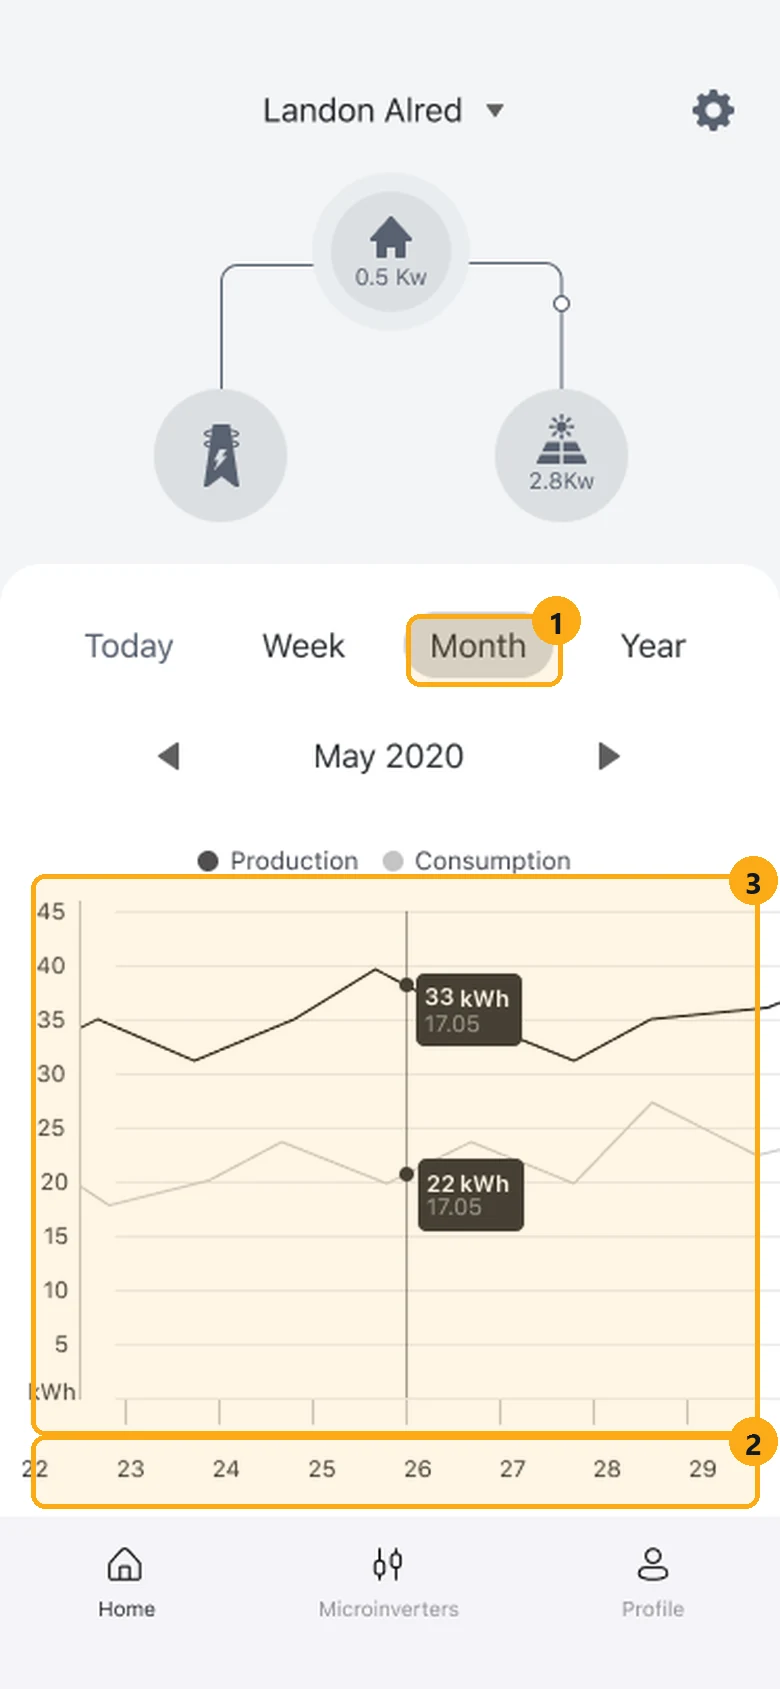
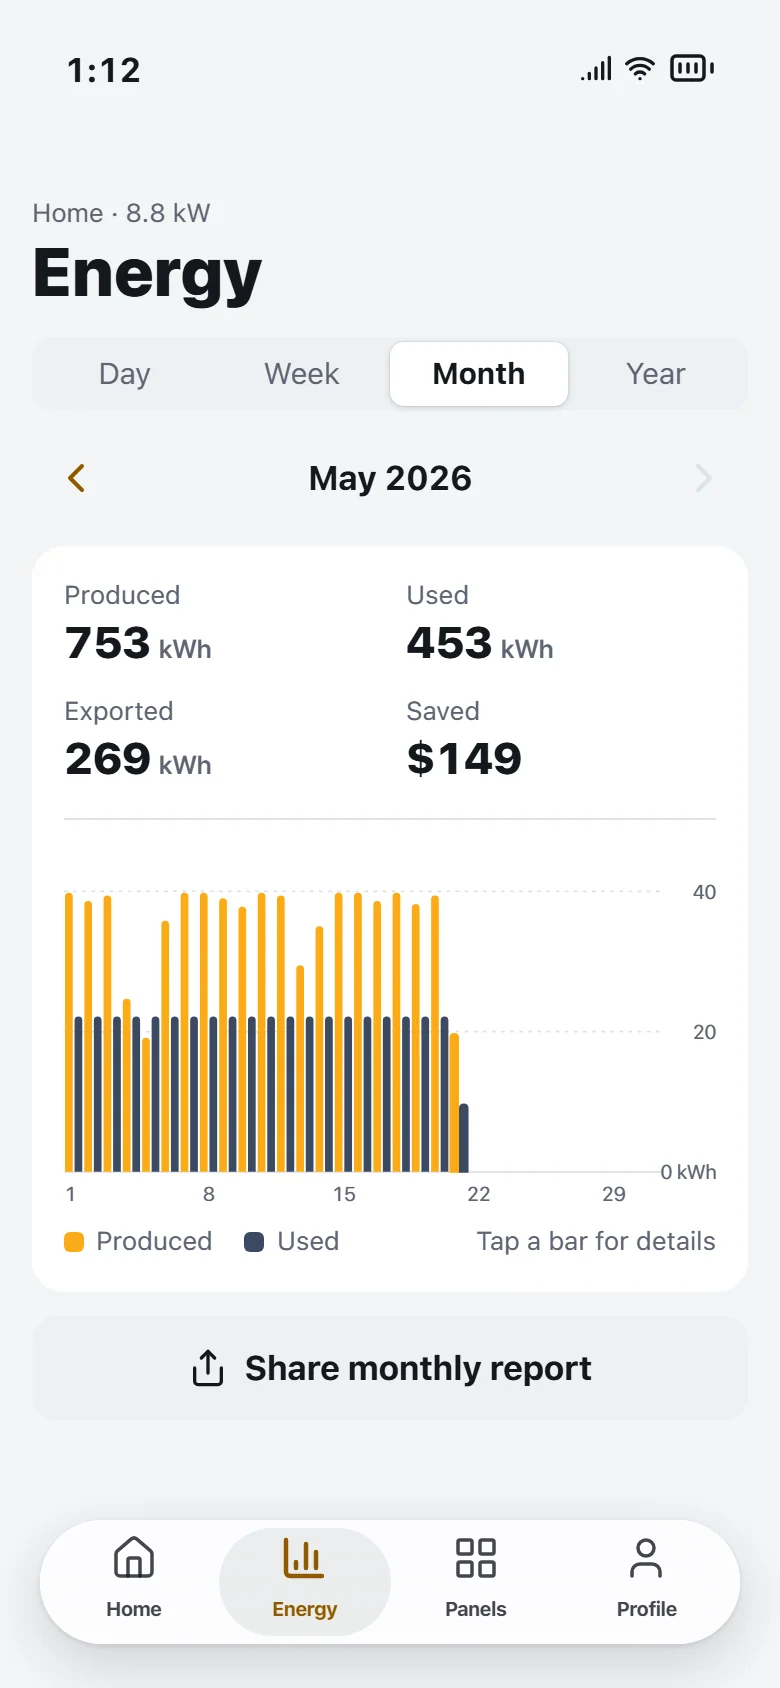
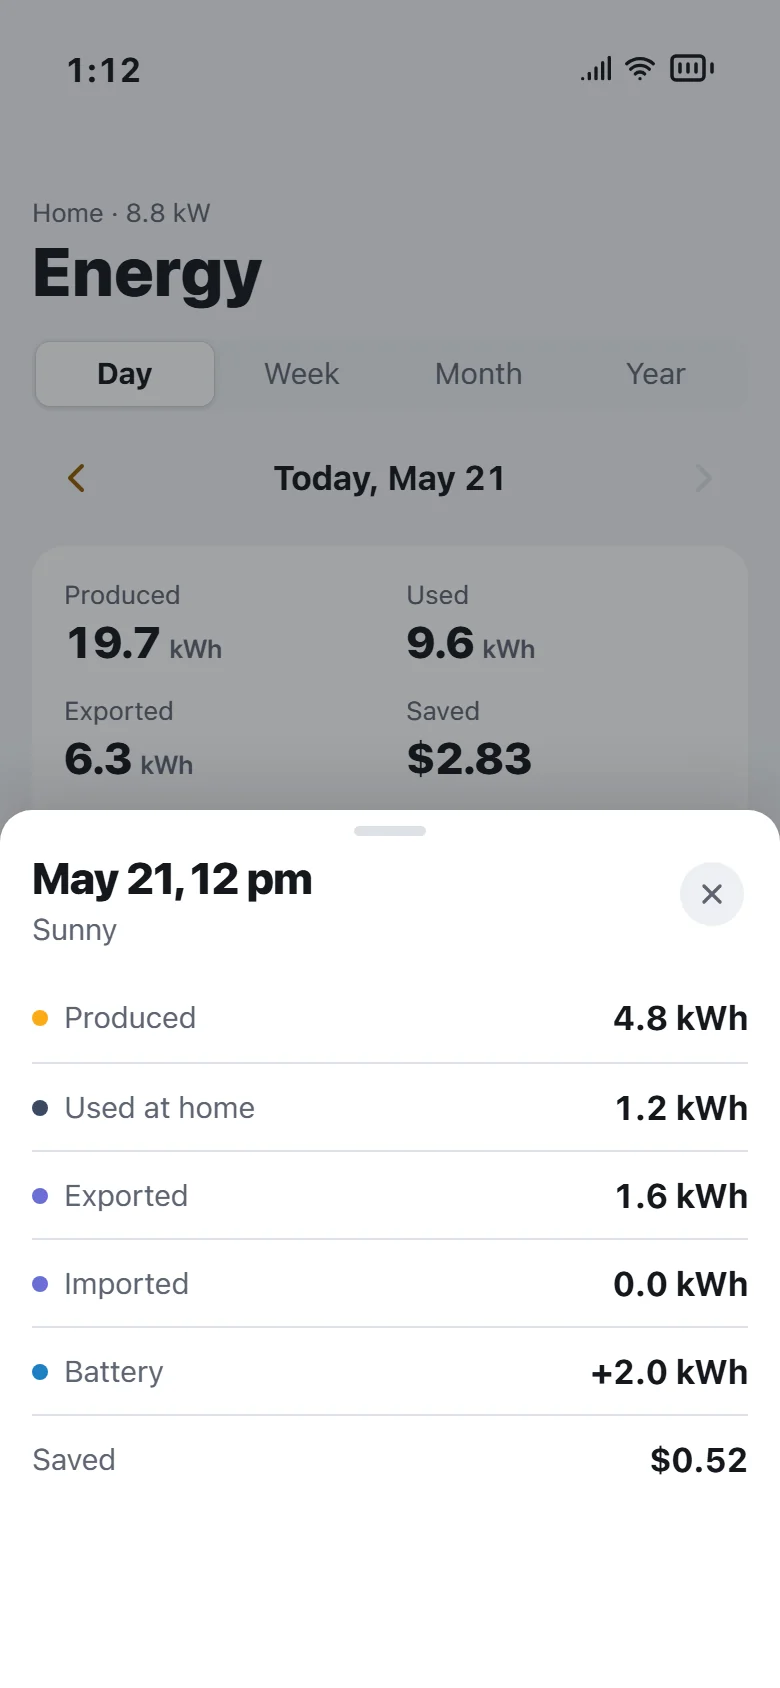
Charts looked right and weren't
Energy totals are bars in kWh, power is a curve in kW, never mixed. The running period is hatched, and tapping a bar opens exact values with the weather that day.
Version 1 · 2021
Redesign · 2026
Finding 03
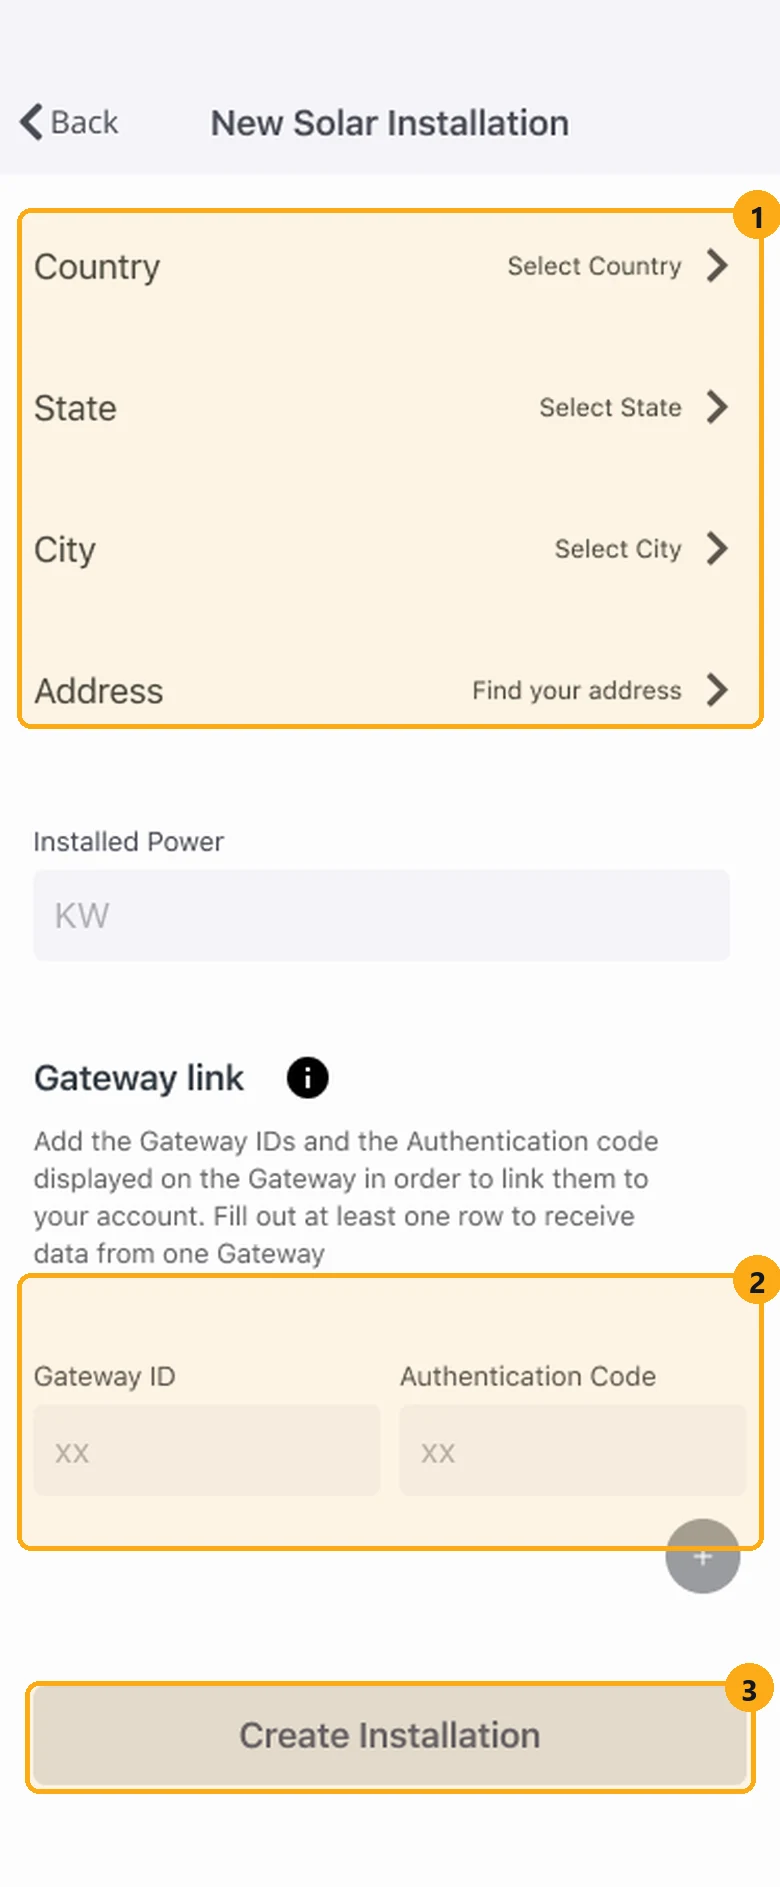
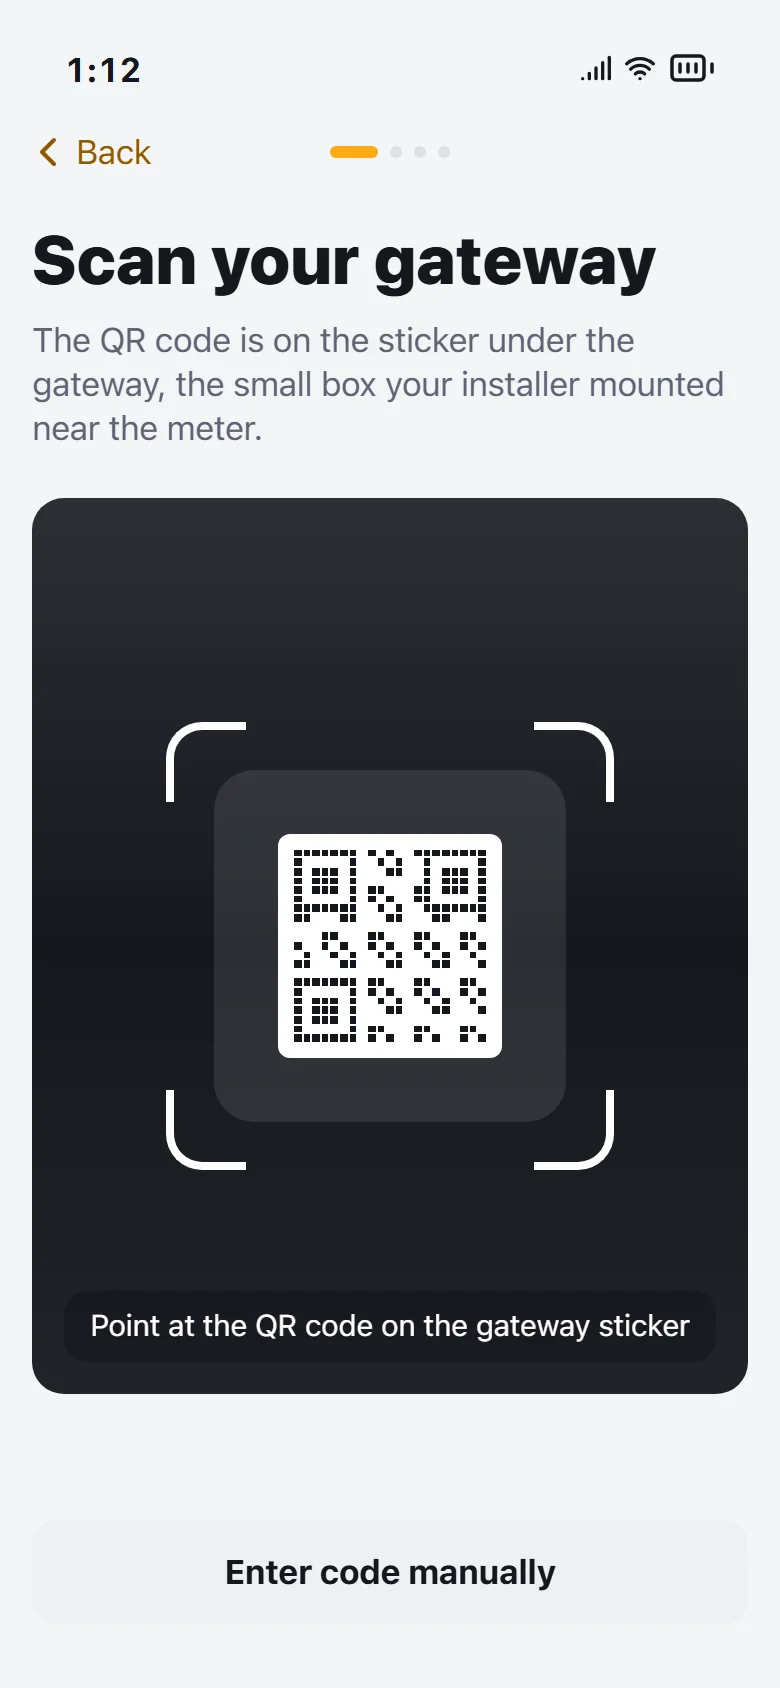
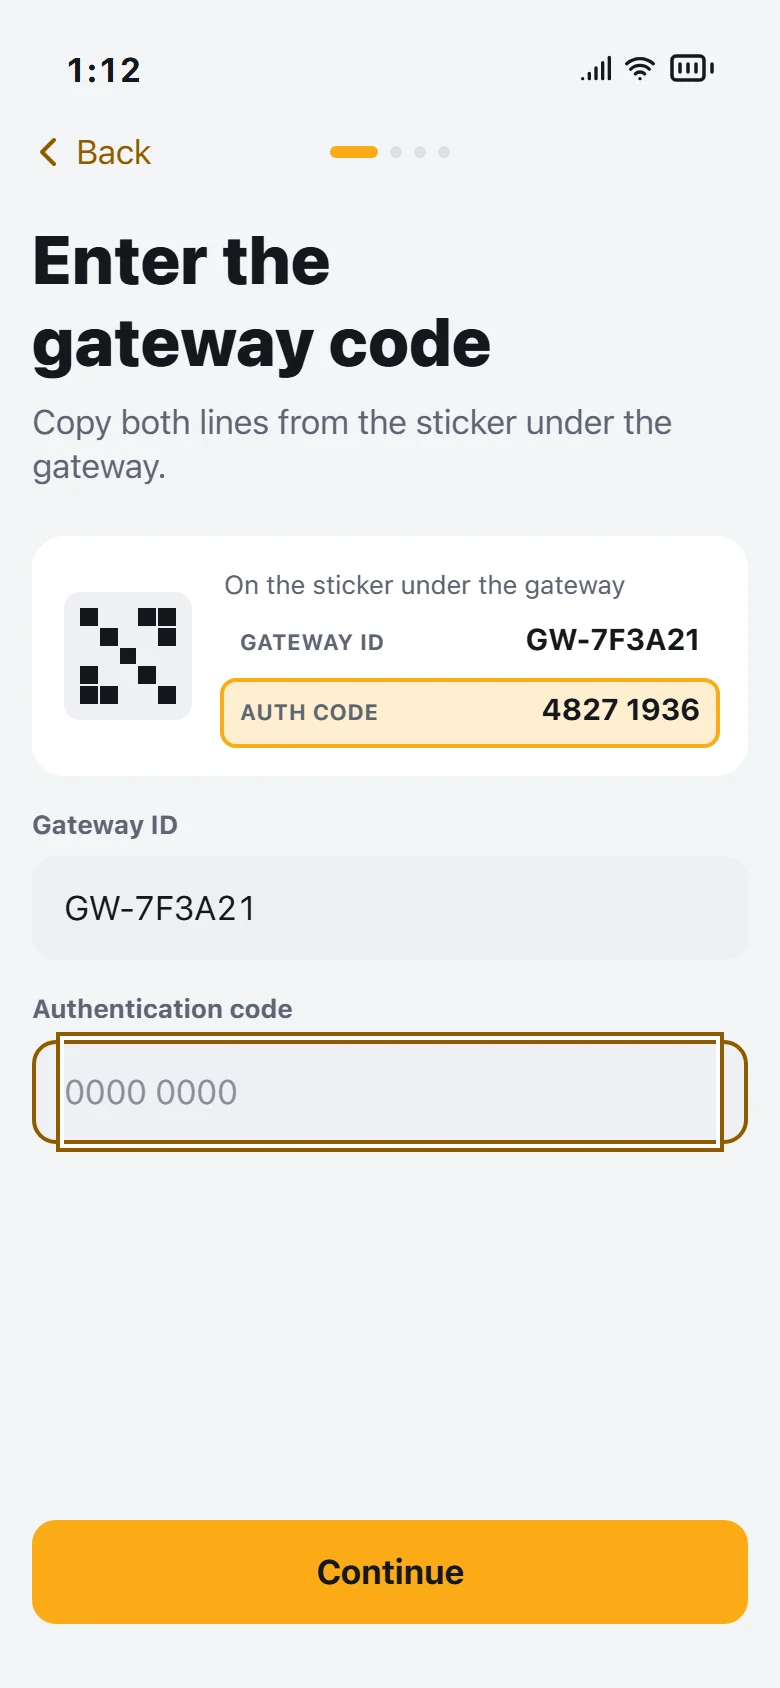
Setup meant copying codes
Scan the QR on the gateway; manual entry is the fallback, with the sticker drawn and the line you are typing highlighted. One address search replaces four pickers.
Version 1 · 2021
Redesign · 2026
Finding 04
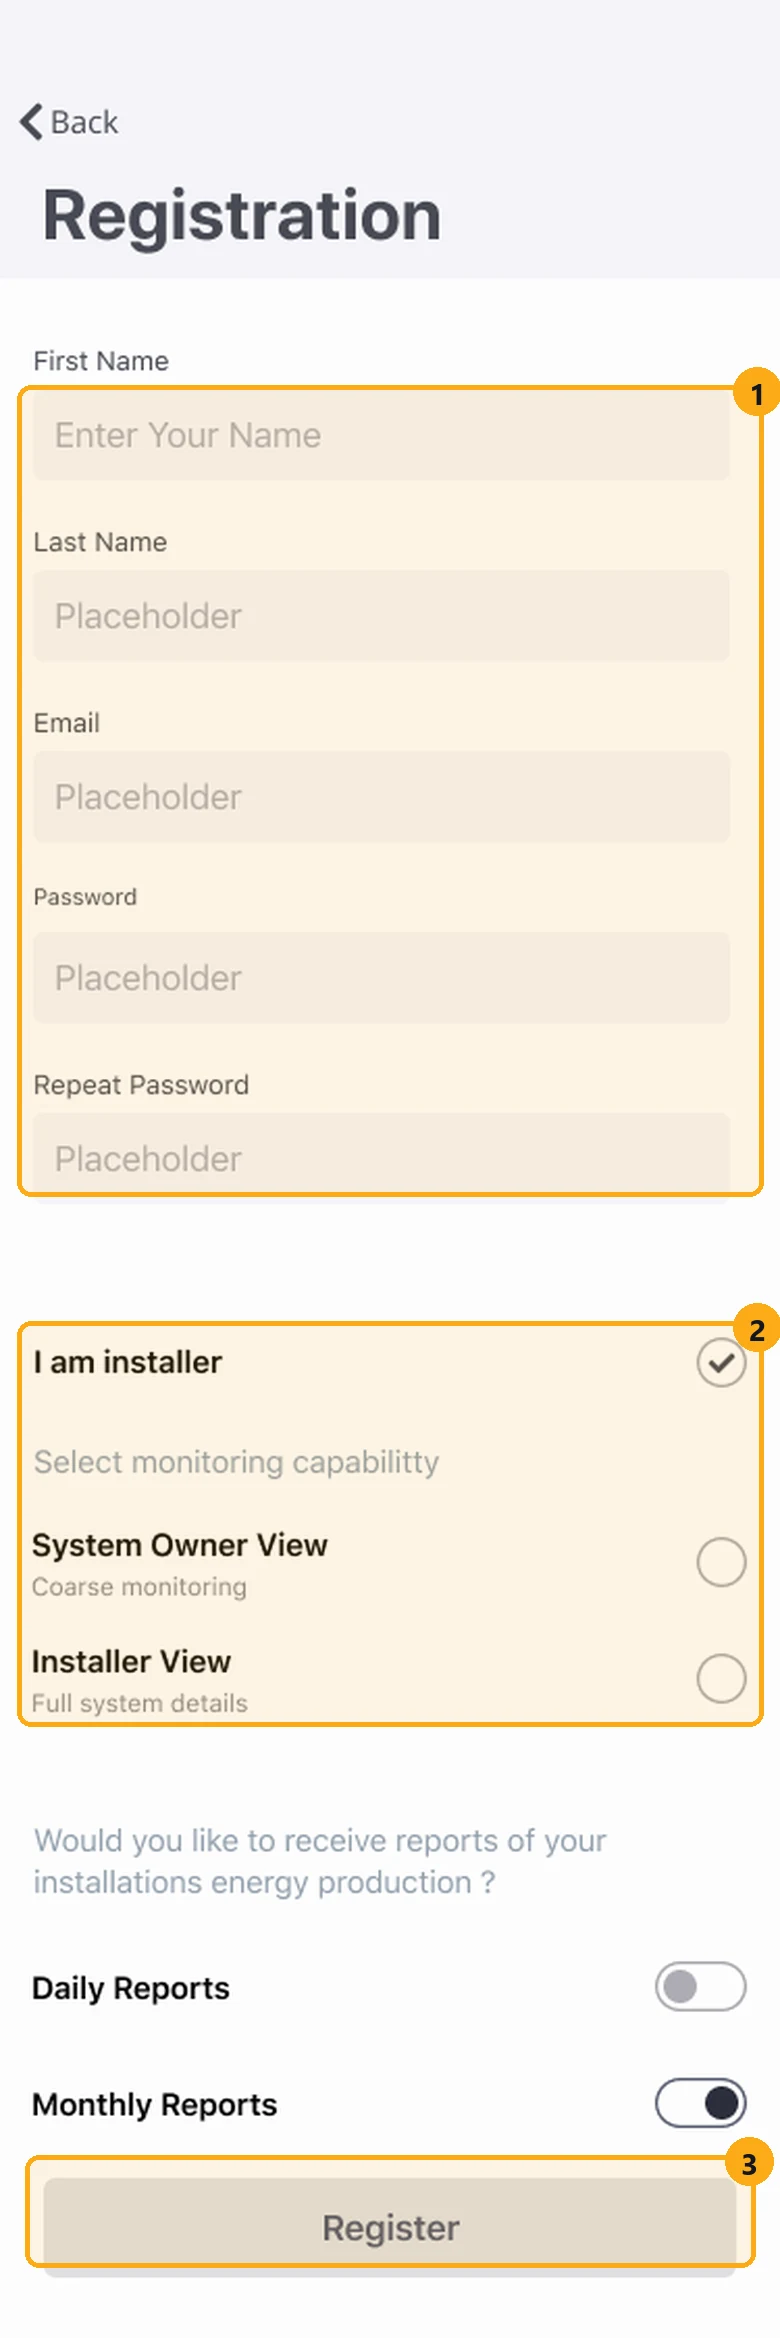
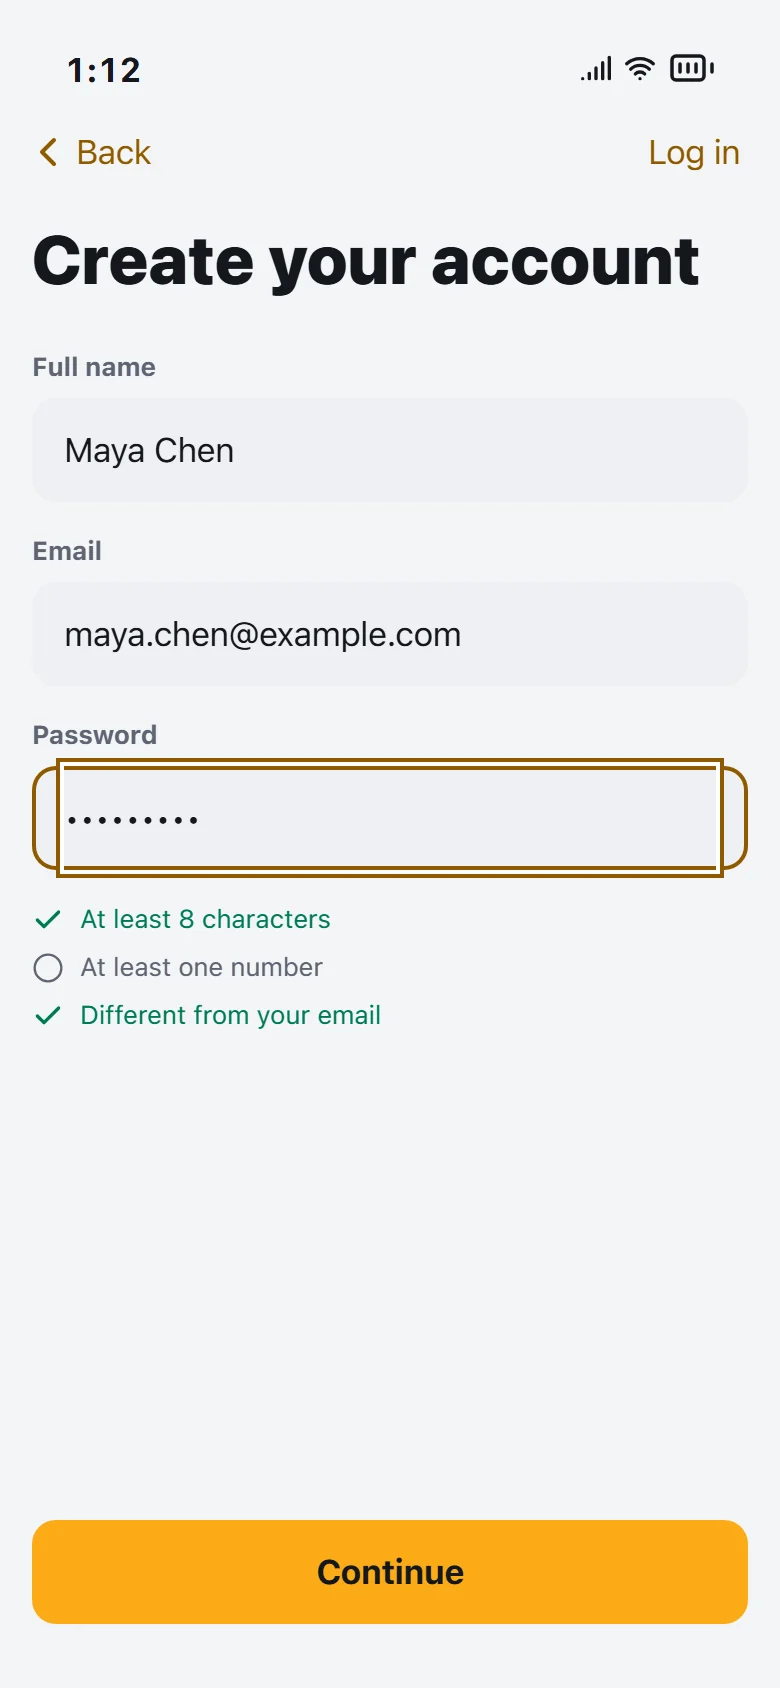
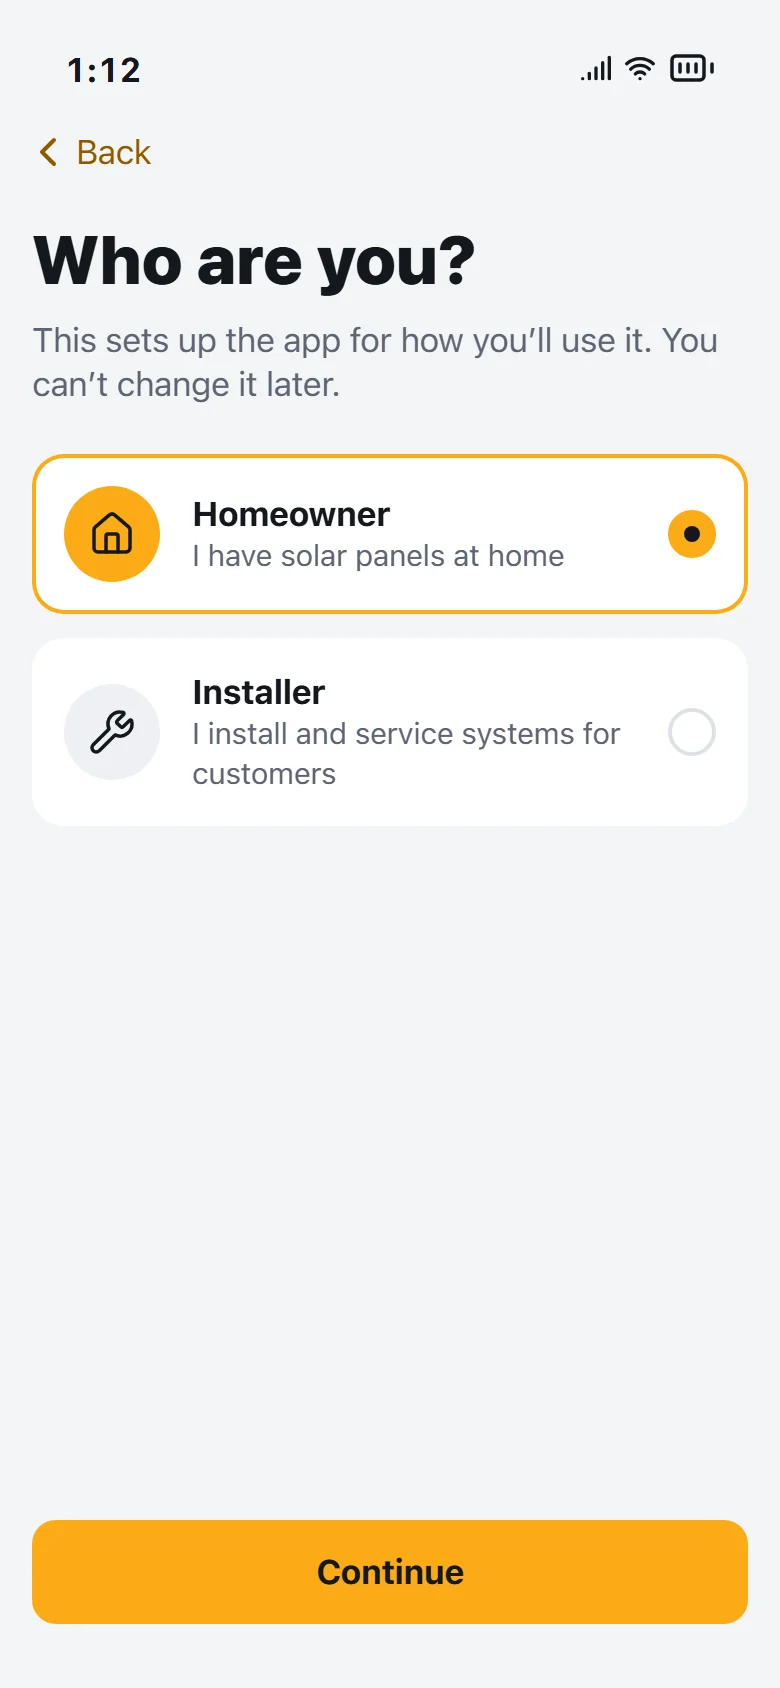
Sign-up hid what mattered
Real labels, password rules that tick as you type, and the role as the first real choice, because it decides the whole app.
Version 1 · 2021
Redesign · 2026
Key flows
Two roles and a setup, clicked through end to end.
Homeowner
Check, understand, act
Home answers in a second; Energy explains any day, week, month or year; Panels shows the roof. Savings use the owner's own rate and export credit, and ask for it only where the number would be.
See the homeowner user flow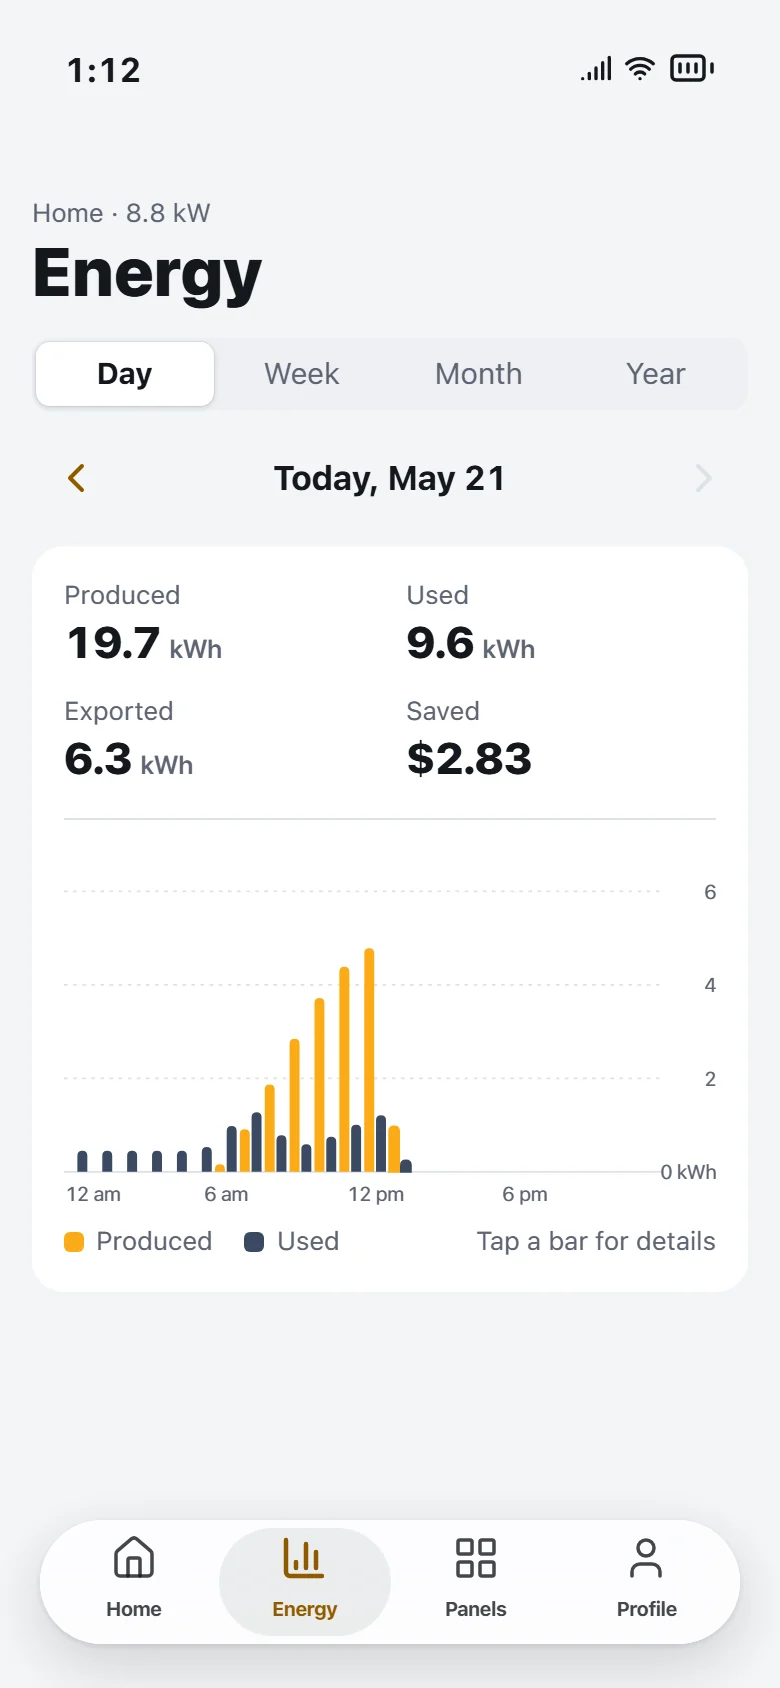
Installer
Fleet first, fix remotely
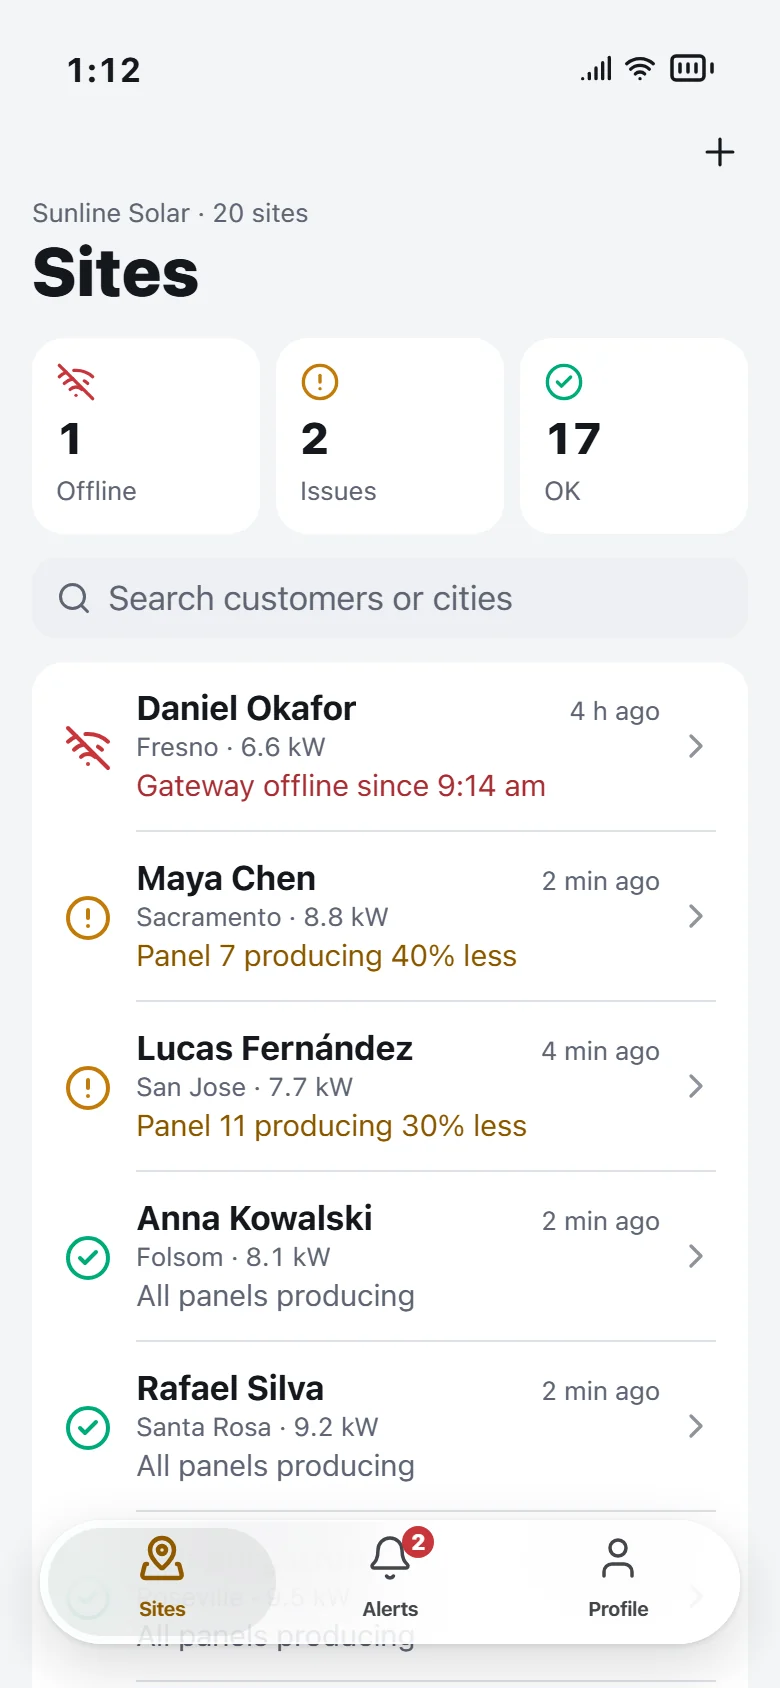
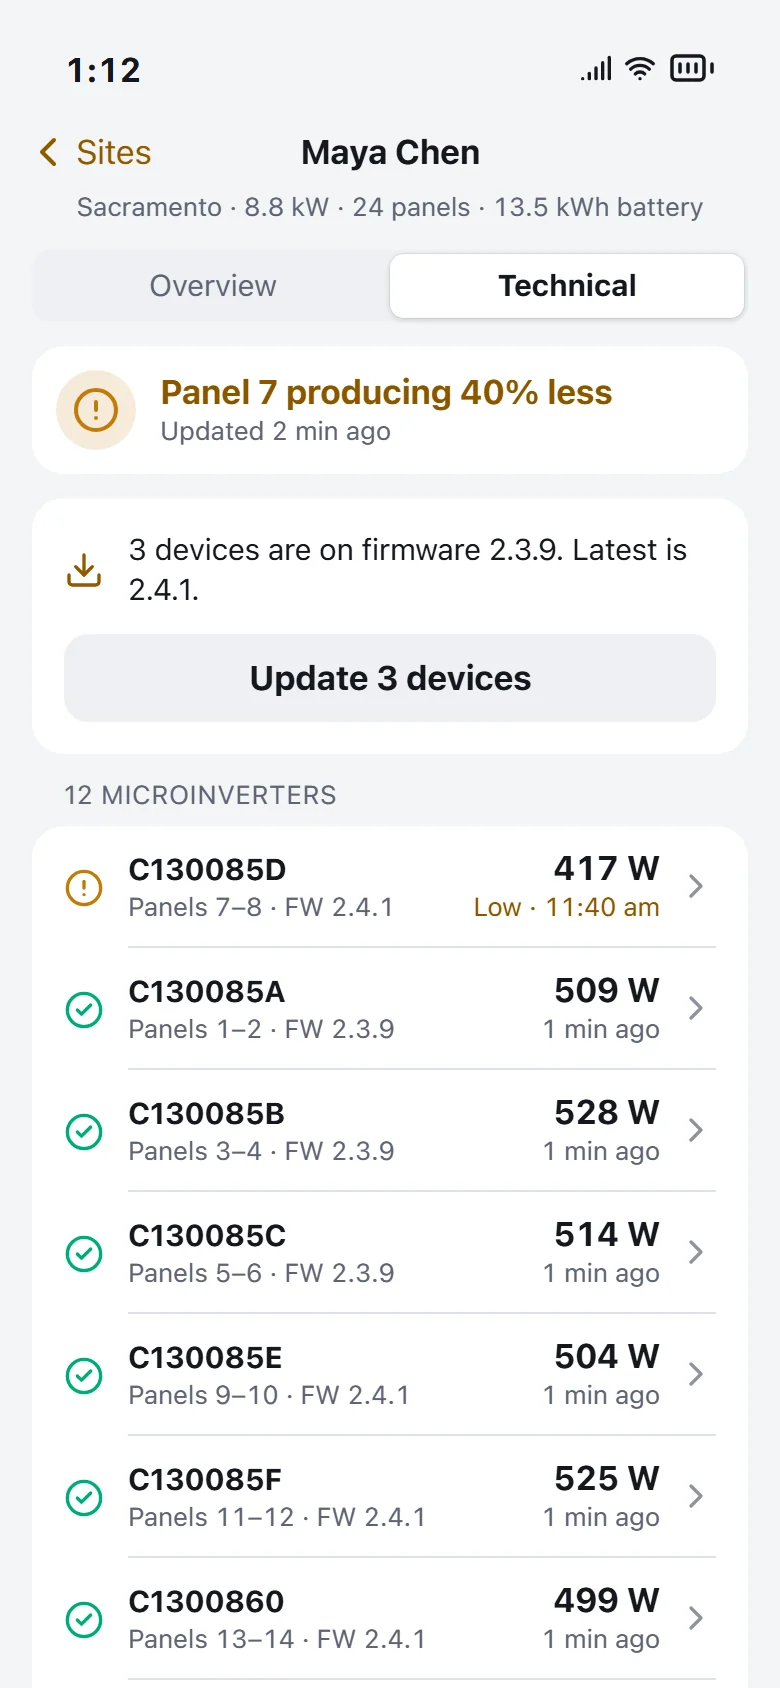
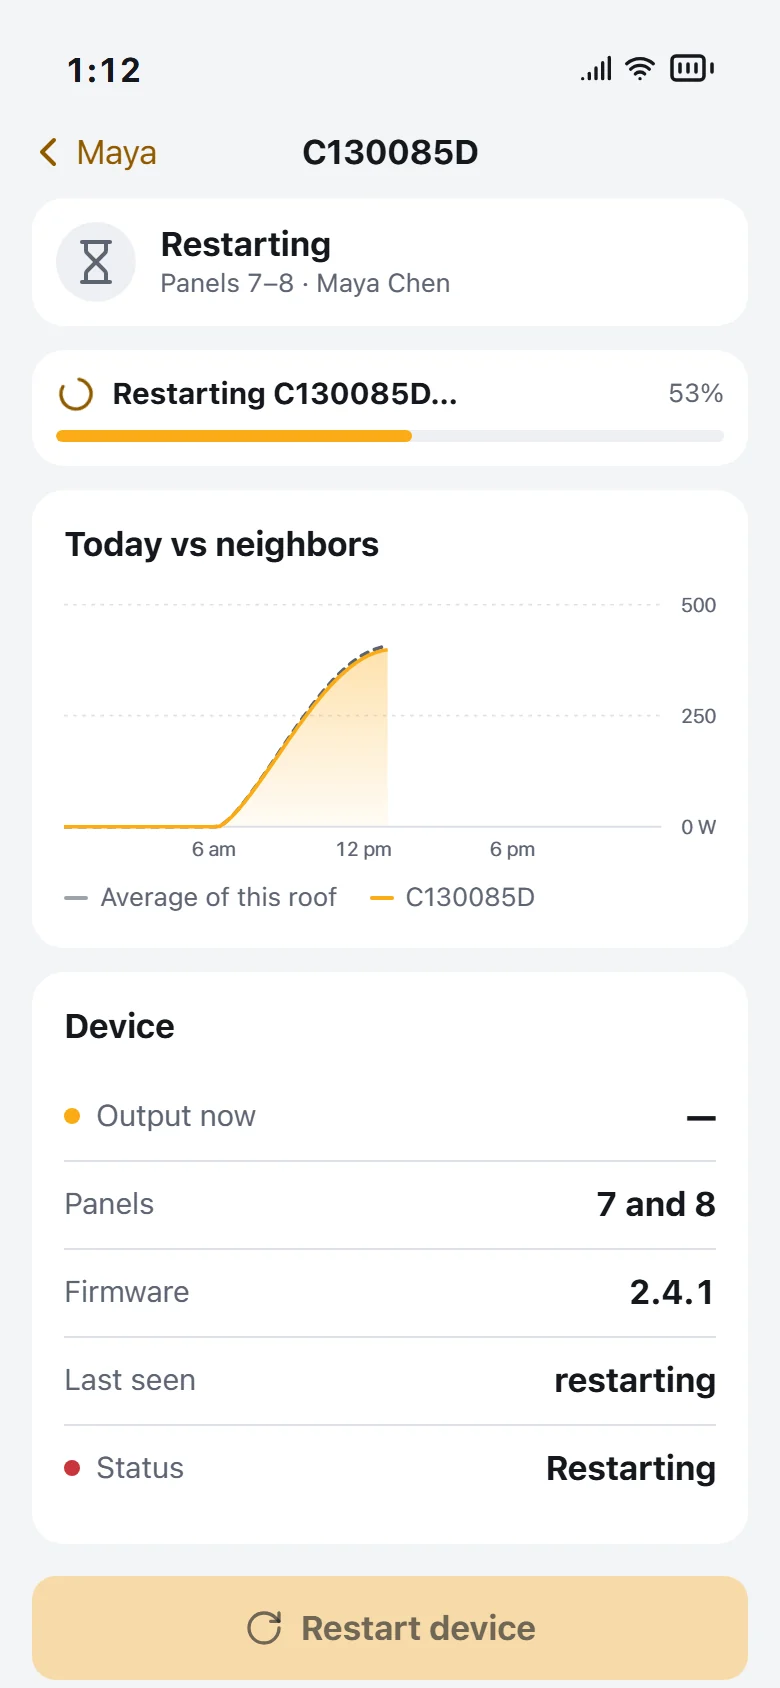
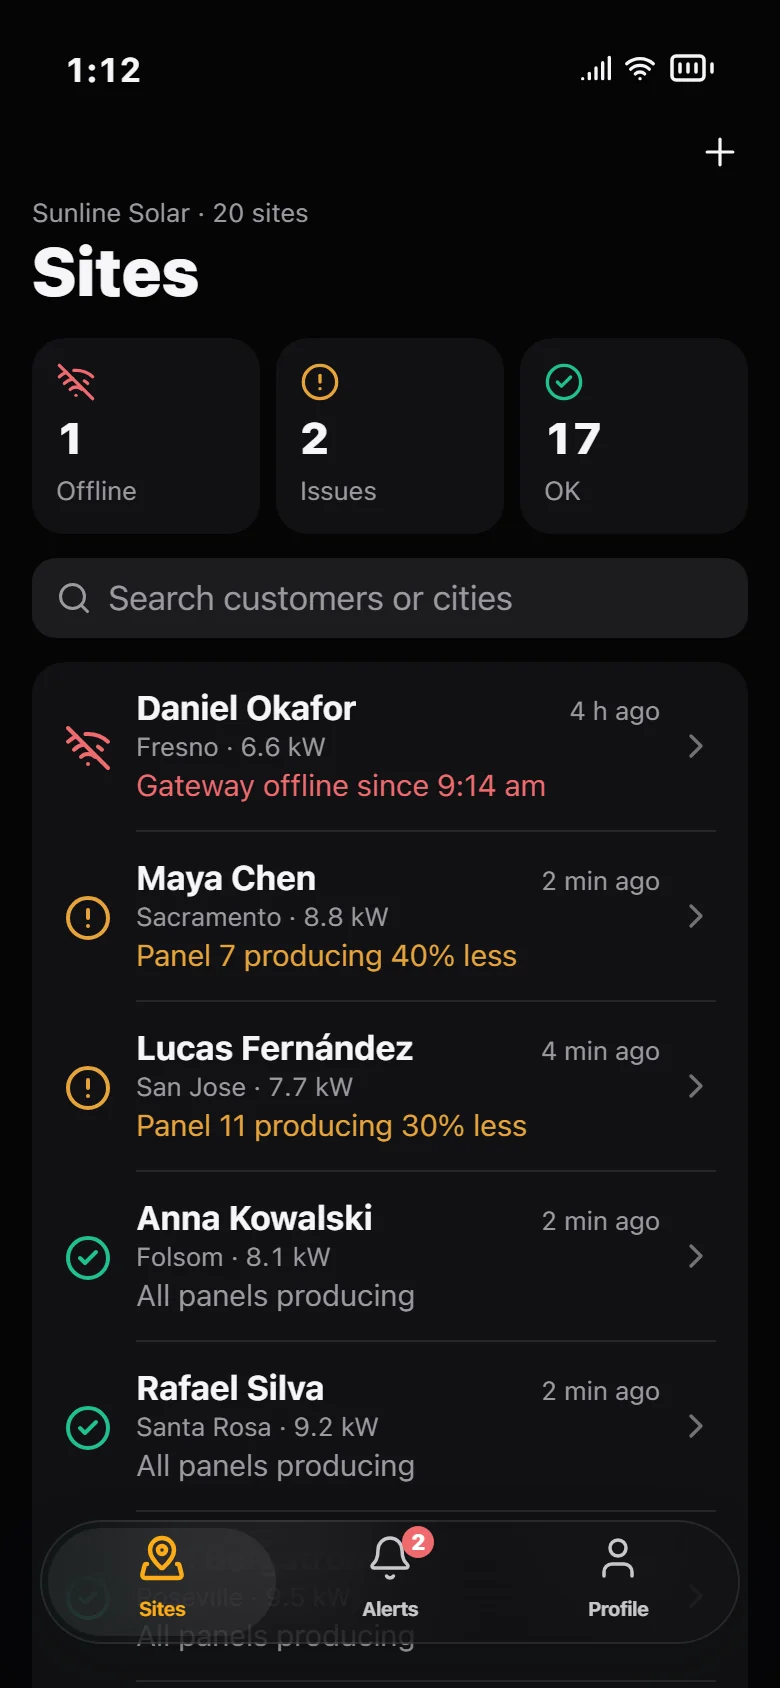
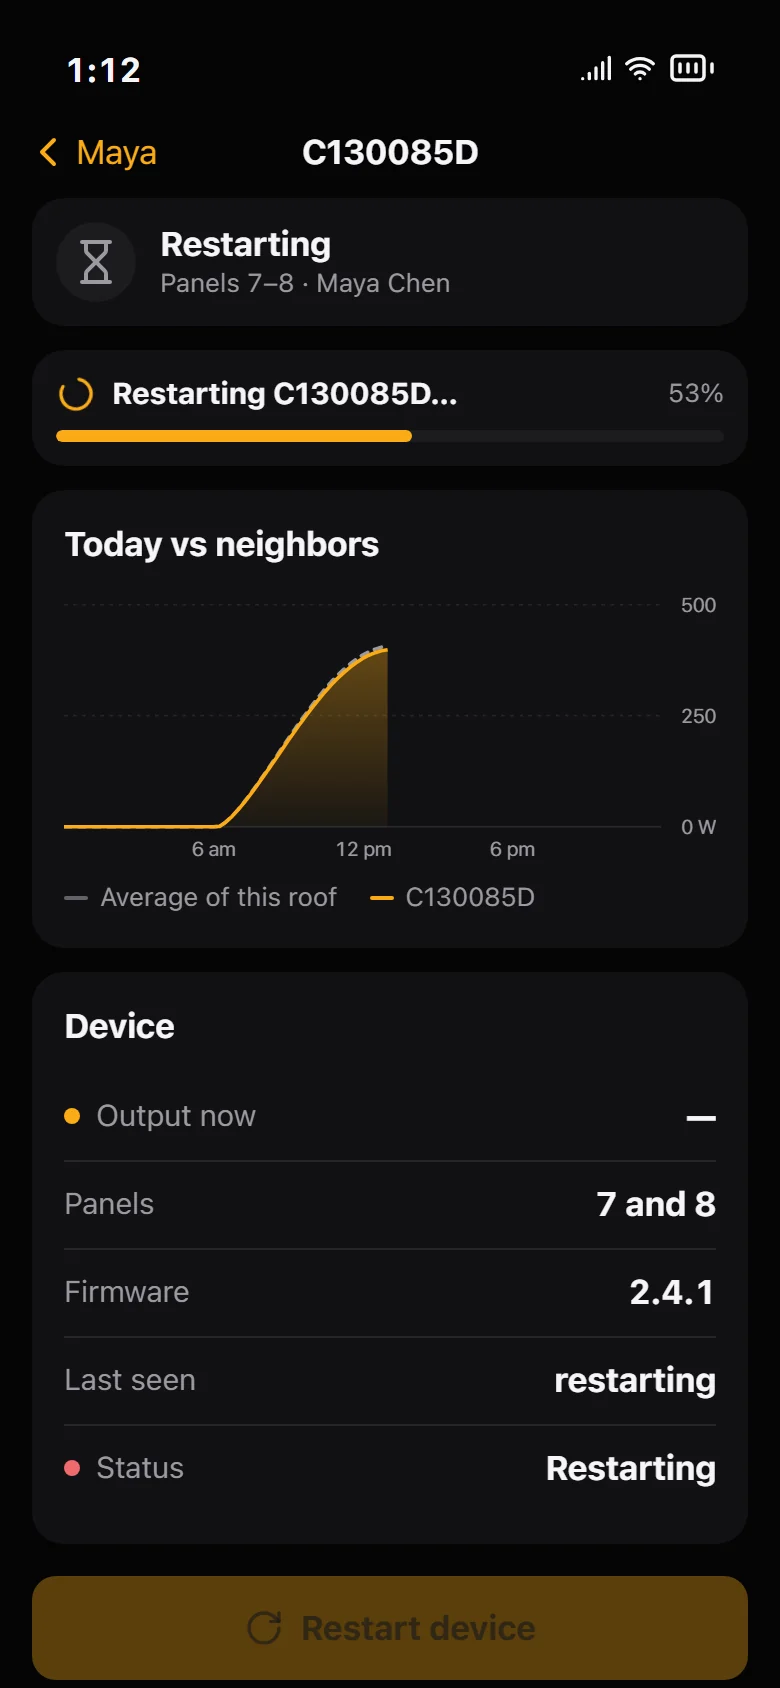
Sites sorted by status, alerts across the fleet, and a technical view per site. Restart a device or update firmware from the phone; schedule a visit when the gateway is offline; resolve with a note the owner will read.
See the installer user flow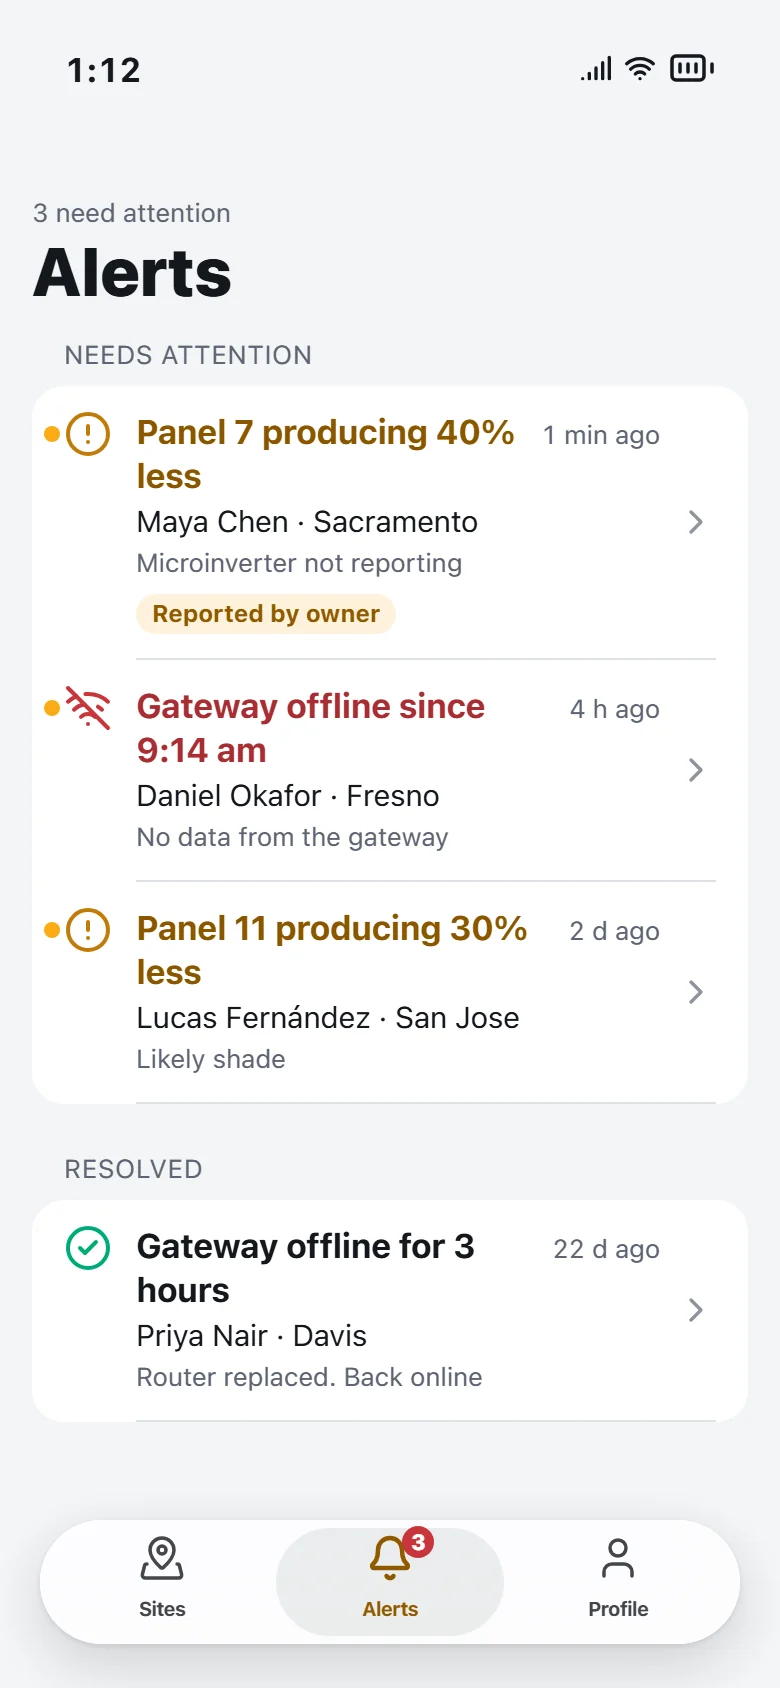
Setup
From the box to the first numbers
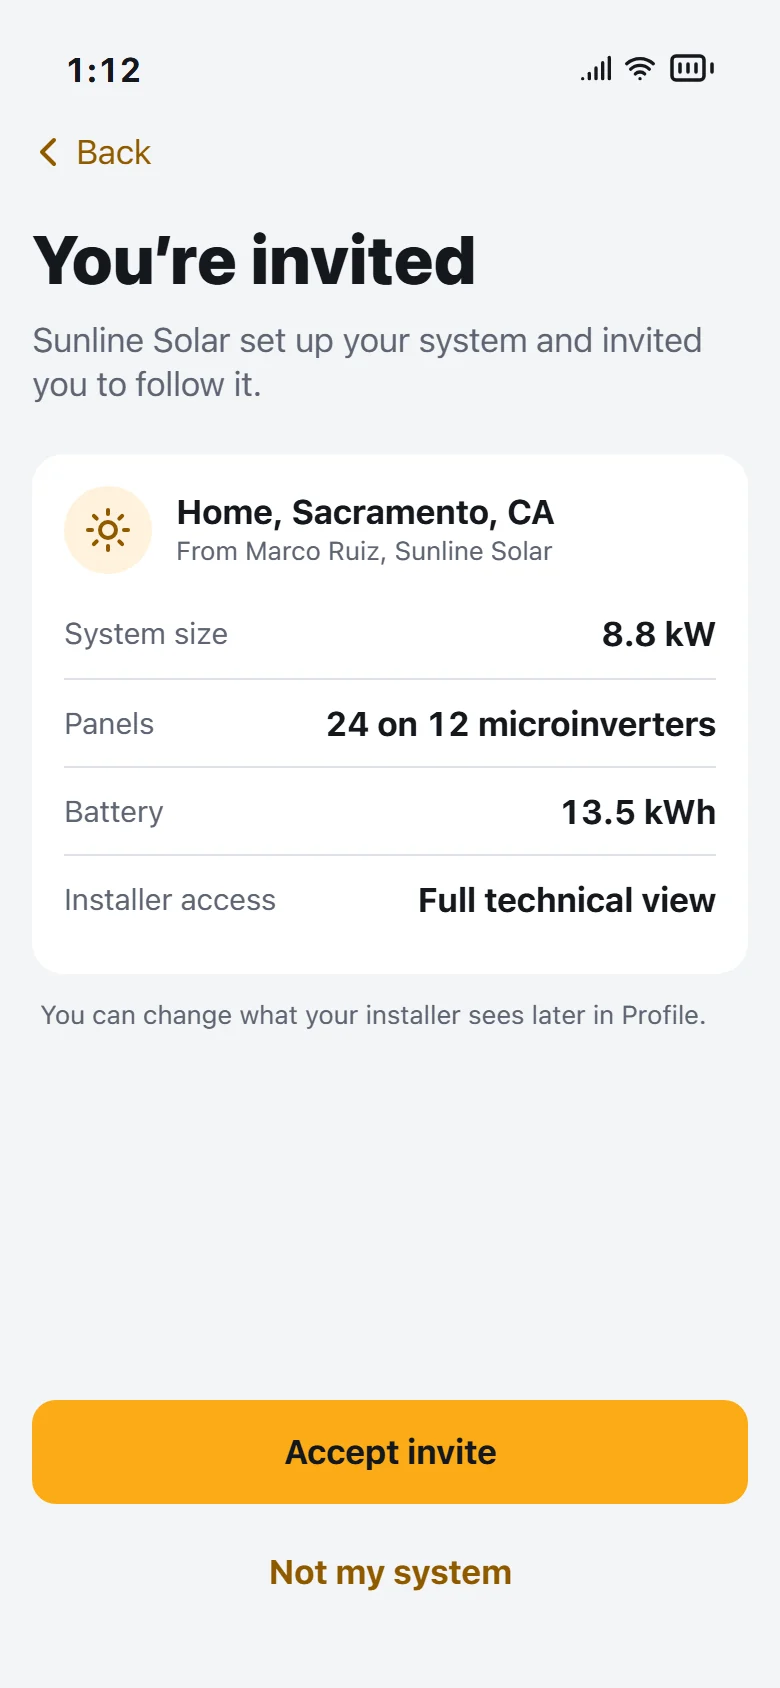
Sign up, choose a role, scan the gateway, confirm the address and size, connect. If the gateway cannot be reached, the app lists what to check instead of failing. Invited owners skip all of it.
See the setup user flow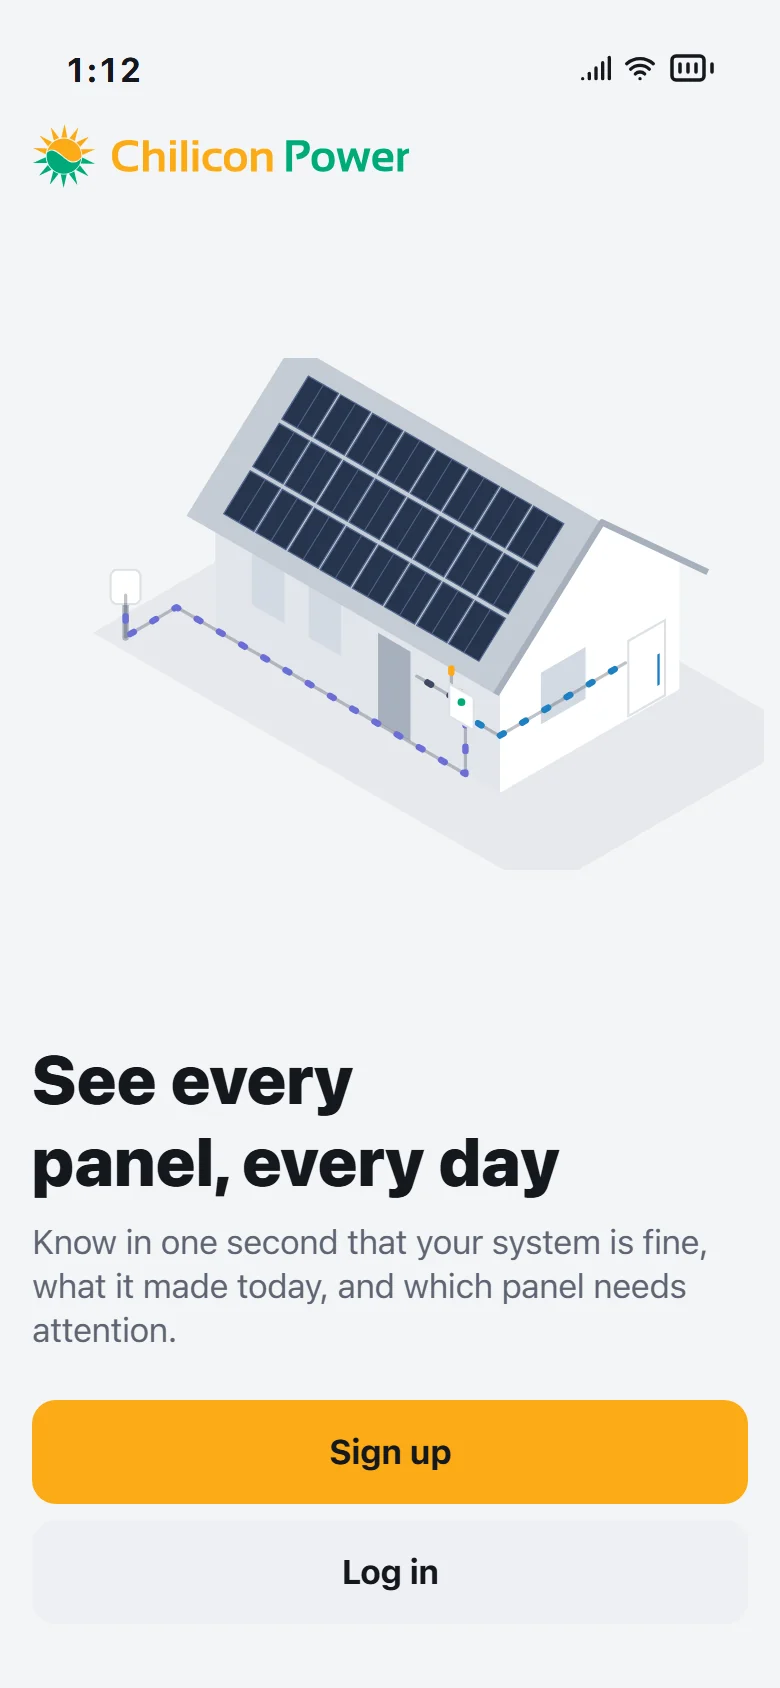
Hard states
Most of the time, the right answer is “nothing to do”.
Design system
A system built from the logo, in light and dark.
The sun orange of the logo is the brand and solar energy; its leaf green is “all good”. Battery is blue and the grid violet, and those four energy colours never swap meaning. SF Pro, iOS large titles that collapse, a floating tab bar. Tokens live in one file and drive the app and Storybook, where every component and every real screen is documented.
- •Units are sacred: kW for power, kWh for energy, never mixed
- •Status is always icon and words, never colour alone
- •The dark theme is near-black and neutral; colour comes only from energy and status
- •Every number is tabular; touch targets are 44 points




- Sun#FBAB16· from the logoBrand and solar energy: primary buttons, production bars, the flow from the roof
- Leaf#00AA79· from the logoStatus OK: “All 24 panels producing”
- Battery#1E7FC2Battery charge and discharge. Blue, so it never reads as the green OK
- Grid#6B6FD6Grid import and export
Outcome
What exists today.
2
roles connected in one clickable fault-to-fix scenario
29
screens, from sign-up to a remote restart, in light and dark
45
components documented in Storybook, plus every real screen
10
scenarios reachable by link: night, offline, no battery, no tariff and more
102
automated checks of every scenario on every screen, 0 problems
0
WCAG 2.1 AA violations (axe) across 28 screen checks
How we'll know it works
Targets to set with the team for launch, not results.
Owners who finish setup without contacting support
QR scan and a clear offline path should remove most setup calls
80%80%
Time from a panel fault to owner or installer action
Today a weak panel can go unnoticed for weeks
Under 24 hoursUnder 24 hours
Support requests per 100 systems
Setup and “is this normal?” are the usual questions
−30%−30%
Issues resolved remotely by installers
Restart and firmware from the phone save a truck roll
1 in 21 in 2
Owners who check at least weekly
A healthy app is checked, not stared at, and monitoring keeps the warranty valid
60%60%
Key takeaways
Three things this project taught me.
- 01
An answer beats a gauge
The data was always there. Putting one sentence above it, “All 24 panels producing, updated 2 min ago”, did more than any chart.
- 02
Silence is a feature
Writing down when not to alert, night and clouds, mattered as much as the alerts themselves. Trust comes from not crying wolf.
- 03
One model, two lenses
Owners and installers see the same roof. Owners get meaning, installers get mechanics, and a report from one lands tagged in the other's feed.
Try it yourself
Switch between homeowner and installer in the live prototype, try any scenario, or read the design system.